Earlier this month, I discussed the inverted yield curve and applied it to the NBA. In this piece, I’m going to apply it the MLB, because I didn’t bore you enough in the previous article and nothing screams “popular and applicable” like a piece on economics and a sport that isn’t yet in the regular season. Ultimately, I’m going to show you a trend that could help you avoid pitchers who as a cohort might look good but collectively suck.
This is the 15th installment of The Labyrinthian, a series dedicated to exploring random fields of knowledge in order to give you unordinary theoretical, philosophical, strategic, and/or often rambling guidance on daily fantasy sports. Consult the introductory piece to the series for further explanation on what you are reading.
Reminding You How Boring Economics Can Be
For those who don’t remember, an inverted yield curve (to quote my earlier article) “is the graphic representation of an economic environment in which the current market provides higher interest rates for short-term debt instruments than for long-term debt.” It looks like this:
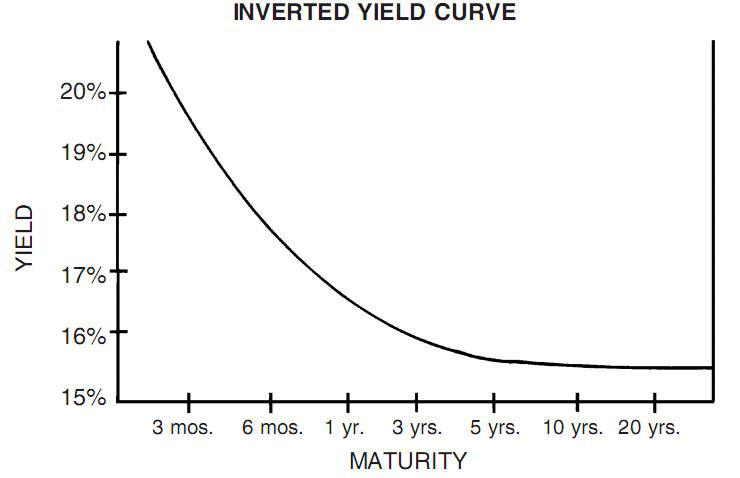
Essentially, an inverted yield curve is the sign of economic instability. In a regular financial environment, a positive correlation exists between loan duration and interest rates. The longer the loan, the higher the interest rate. There are times, though, when a negative correlation exists between time and interest rates — when short-term Treasury bonds have higher interest rates than long-term Treasury bonds. And when that happens the United States normally experiences an economic recession.
The Inverted MLB DFS Yield Curve
It’s not all that hard to apply the dynamics of the inverted yield curve to MLB. All we need to do is focus on factors showing a divergence between the normal correlation that should exist between time and money on the one hand and yield (or production) on the other hand.
In our MLB Trends database, the interplay between time, money, and yield can be seen through a simple backtest. Let’s look at pitchers, since (unlike batters) they have many opportunities per game to accumulate points and thus should exhibit greater consistency. And then let’s look only at those pitchers whose seasonal salaries have increased but whose seasonal salary-adjusted production has been negative (per our Plus/Minus metric):

And I think that we can make this group even better (read: worse). For instance, we could add another production filter to the trend by screening for players with a Pro Trends Rating in the bottom half of the data set. And to ensure that we’re not merely screening for a bunch of bottom-dwelling throwers unlikely to be in our lineups, we can set a minimum salary of $5,000:

This trend is the functional MLB DFS equivalent of an inverted yield curve: As a cohort, the players who fit this trend tend to fail.
Over the last two seasons, this trend has held true (negative) in the aggregate from month to month, and of particular interest is that this cohort has by far been at its worst in the first month of the season:
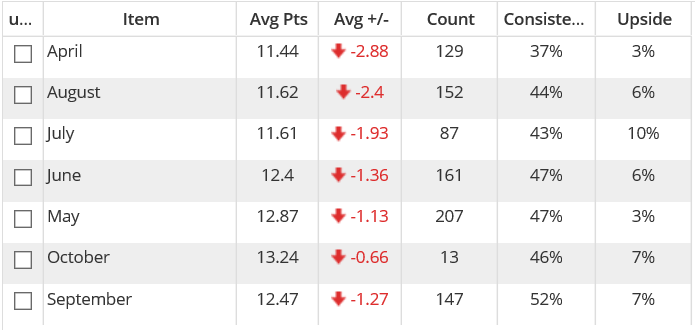
In seeing this month-to-month consistency, we have greater assurance that this trend is not merely a fluke. And in knowing that this trend has historically been most powerful in April, we may have found a trend that will be exceptionally actionable right away.
Rule No. 1: Don’t Lose Money
The first rule of value investing (whether one invests in the stock market or cars) is the following edict: Don’t lose money. In DFS, by avoiding the types of players who don’t consistently live up to their salary-adjusted expectations, we greatly increase the chances that we will not lose money.
In the first month of the season, when you will have to make adjustments for unreliable pricing on some platforms, this trend should help you avoid bankroll erosion.
Also, some of the pitchers in this April cohort are historically better than awful. For instance, Madison Bumgarner, Matt Cain, Ian Kennedy, James Shields, C.J. Wilson, Bartolo Colon, and even knuckleballer R.A. Dickey have all appeared in the April version trend at least once. I’m not saying that all of those guys are elite, but it is very possible that in any given slate in April of 2016 we will see some pretty decent pitchers who fit this trend and appear in a decent percentage of tournament lineups.
In other words, it’s also possible that this April trend could help you find some miniature first-month negative Black Swans.
———
The Labyrinthian: 2016, 15
Previous installments of The Labyrinthian can be access via my author page. If you have suggestions on material I should know about or even write about in a future Labyrinthian, please contact me via email, [email protected], or Twitter @MattFtheOracle.