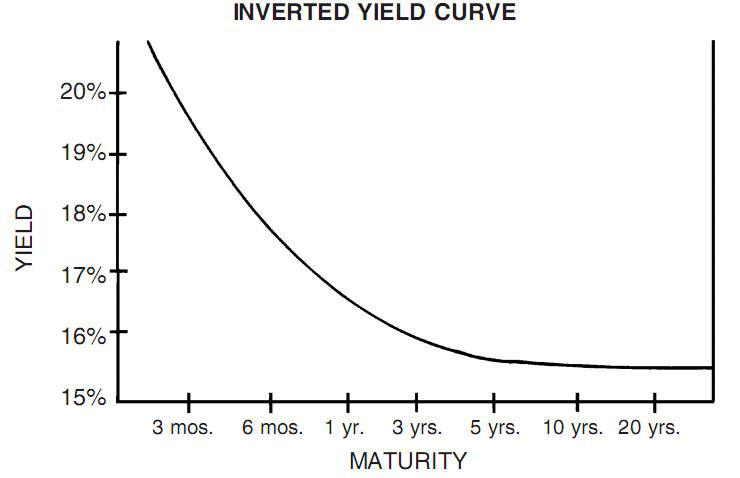
By definition, an inverted yield curve is the graphic representation of an economic environment in which the current market provides higher interest rates for short-term debt instruments than for long-term debt. This is what that looks like:
If you ever want to bore people at a dinner party (or in a fantasy sports article), start talking to them about an inverted yield cu . . . . . . . . what happened? I must’ve fallen asleep.
This is the seventh installment of The Labyrinthian, a series dedicated to exploring random fields of knowledge in order to give you unordinary theoretical, philosophical, strategic, and/or often rambling guidance on daily fantasy sports. Consult the introductory piece to the series for further explanation on what you are reading. Just think of this as the DFS version of The Neverending Story.
How to Predict a Financial Crisis
What’s so special (read: almost interesting) about an inverted yield curve? Well, for one, it’s abnormal. In table economic environment, a positive correlation exists between the amount of time a borrower gets to keep leant money and the interest rate paid on that money. The longer the loan, the higher the interest rate. Intuitively, that makes sense. For instance, in all but the most destitute of financial climates, a three-month Treasury bond has a lower interest rate than a 10-year Treasury bond.
But sometimes borrowers are in such a bad position that the market is able to dictate drastically higher yields on short-term debt — because lenders recognize the desperation of the borrowers — and when that happens the normal correlation between time and interest rates is inverted. In these relatively rare situations, a three-month Treasury bond has a lower interest rate than a 10-year Treasury bond. And when that happens . . .
#ZombieApocalypse
Most recessions in the history of the United States have been preceded by an inverted yield curve. It’s a sign that the economy is unstable and likely to collapse. Specifically, since 1970 a perfect correlation has existed between inverted yield curves and market collapse. Each of the seven recessions over that timeframe has been preceded by an inverted yield curve, and each inverted yield curve has been followed by a recession within a year or so.
An inverted yield curve doesn’t necessitate that a recession must occur. It just means that one is likely to occur.
Does An Inverted DFS Yield Curve Even Exist?
Why not? When looking at players, we can focus on the factors of time and production to find something that approximates the disastrous dynamic of the inverted yield curve. In economics, the relationship between time and money on the one hand and yield (or production) on the other hand is intuitive, and the same general relationship exists in DFS.
In our NBA Trends database, the interplay between time, money, and yield can be seen through a simple backtest. If we combine two screens to look solely at the players whose DraftKings salaries haven’t decreased in the last year (Fantasy Season Filters) and whose Projected Plus/Minus scores are no better than 0.0 (Projections) — in general, players whose salaries have increased and production hasn’t — we see what might be the most depressing trend ever created on the FantasyLabs platform:

This trend is the functional DFS equivalent an inverted yield curve: Taken as a cohort, the players to whom this trend pertains consistently fail.
Create this trend for yourself. You’ll find that not in one month over the last year has this combination of factors resulted in an aggregate positive Plus/Minus. Just as investors in the paper markets (stocks and bonds) should be wary of an inverted yield curve, in DFS we should be cautious about players who sport this negative trend: the inverse correlation between long-term salary escalation and short-term projected underperformance.
If you roster players who fit this trend, you might be able to find some players on occasion who don’t underperform their salary-adjusted expectations, but if you play such players consistently you will find yourself creating suboptimal lineups, especially in cash games.
Damian Lillard: DFS Lineup Destroyer?
It’s probably unfair for me to single out Lillard, but for the slate of Feb. 8, 2016 — the day I’m writing this — of all the “Inverted DFS Yield Curve” players, he is the one with the highest median projection (38.5 DraftKings points) in the Phan Player Model.
Should Lillard absolutely be avoided in this slate? Maybe. The Phan Model gives him a 47.02 Rating for the slate, so he’s not horrible. And over the last year his salary has increased only $100. And although his -1.6 Projected Plus/Minus is below salary-adjusted expectations, it isn’t egregiously so. As far as bad DFS plays go, Lillard isn’t that bad. His DFS yield curve is inverted, but only slightly.
Here’s the thing: Why take a chance on a $9,000 player whom you know to belong to a cohort that collectively underperforms expectations? That is needlessly risky. Just as many investors tend to underestimate the significance of inverted yield curves (and resultantly lose money), we could ignore the proven implications of Lillard’s long-term increase in salary and short-term projected production — but we shouldn’t.
It’s not a 100 percent certainty that Lillard will underperform in this slate, but fading him (and others like him) is the percentage play. Over any period of time longer than just a few slates, the players with inverted DFS yield curves collectively underperform their salary-adjusted expectations, and trying to find a DFS play in such a cohort is like trying to find investable stocks in a market that is about to collapse. It’s possible but not probable and definitely not worthwhile.
The High-Projection Inverted DFS Yield Curve Cohort for Feb. 8, 2016
It’s wrong of me to single out Lillard when there are other players I could also trash.
Here they are: The Feb. 8 slate of players with inverted DFS yield curves and median projections of at least 25 DraftKings points (as of 9:30 AM ET):
| Name | Projected Pts | Projected Plus/Minus | Fantasy Season Salary Change ($) |
| Damian Lillard | 38.5 | -1.6 | 100 |
| Kemba Walker | 34.4 | -1.6 | 1,100 |
| Rajon Rondo | 32.7 | -2.8 | 2,200 |
| DeMar DeRozan | 32.3 | -3.2 | 700 |
| C.J. McCollum | 30.7 | -0.7 | 2,300 |
| Danilo Gallinari | 30.3 | -0.6 | 1,200 |
If all you did this slate were avoid these six high-projection players, that on its own might be enough (with the help of the Phan model) to get the right high-projection players into your lineups.
And of course there are many other inverted DFS yield curve players with much lower projections whom you also will probably want to avoid. I just didn’t see the point in listing a whole bunch of players likely to underperform.
Acting on What We Know
We know that players who possess this negative trend tend to underperform their salary-adjusted expectations rather drastically, just as most investors know that economic recessions tend to follow inverted yield curves.
The problem is that we often ignore what we know. We see an intriguing stock (or a talented player), and we invest at the wrong moment.
My belief is that most errors in life, investing, and DFS have more to do with action than knowledge. We have an awareness of the path to success, yet at any given moment we can find excuses as to why we shouldn’t walk the path.
Today, choosing not to use players with an inverted DFS yield curve is a decision to take another step on the path in the labyrinth.
———
The Labyrinthian: 2016, 7