3-Point Dependency

In a previous article, I started to scratch the surface of shot charts and how they may relate to DFS production. Today, I’m going to continue that theme a little bit by looking specifically at 3-point shooters. However, I want take a somewhat different approach to 3-point shooters that I think will be helpful. Instead of looking at the raw leaders in terms of 3-pointers made, I’m going to look at players with the lowest point-per-game averages after 3-pointers were subtracted – in other words, players whose scoring is most dependent on the three ball.

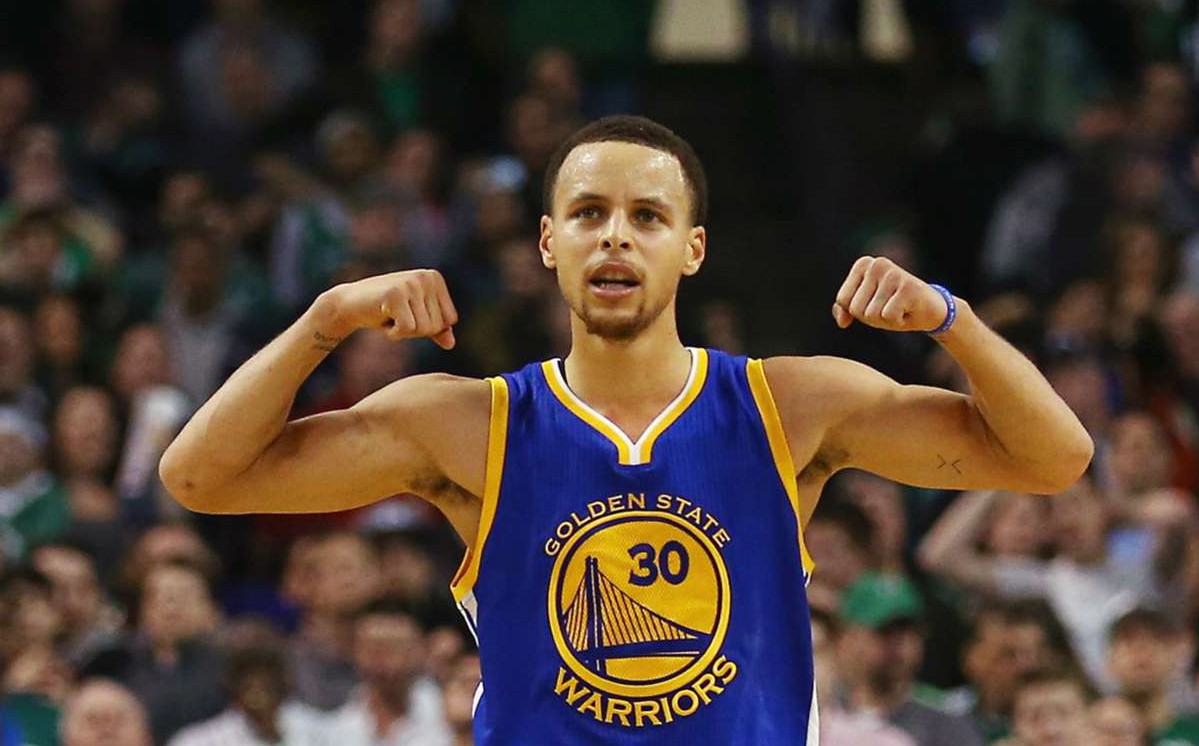
Steph Curry led the league last year with 3.6 made 3’s per game, which accounted for 45% of his overall 23.8 PPG average. That means Steph averaged 13 “non-3-pointer-points-per-game”. Courtesy of Statmuse, I ran a query and found out which players around the league averaged the lowest non-3-pointer-points-per-game (PPGPG Column below) after applying some minimum threshold filters:

3dep1


Some of the top results are pretty interesting – Korver, Ariza, Gordon, and Gallo all averaged 7 or fewer points per game after removing 3-point production. These are also guys who can be very much in play on a given NBA DFS slate. So let’s try and figure out when we can best deploy these types of players in the future by running some trends on Fantasy Labs.

There were a few players who appeared just as a function of the minimum thresholds I set, like Jordan Hill and Motie. After removing those players, here’s is the trend filter:

3dep2


I’ve previously highlighted Kentavious Caldwell-Pope, Danny Green, and Klay Thompson as players who shoot the ball much better at home. I was curious if we would see a notable split in Plus/Minus between home and away games for the shooter group I created.

3dep3


There was a slight boost evident when playing at home, but it was smaller than I expected, to be honest. Coincidentally, the numbers turned out almost exactly the same when splitting for favorites and dogs within the group:

3dep4


I did find a pretty interesting correlation with price change. Below, I compare the differences in “Monthly Salary Change” between all players and the shooting group:

Group

+/- Salary Change +500 or more

+/- Salary Change -500 or less

All Players

+0.86

+1.36

3 Pt Shooters

+1.38

+0.62


The shooters played better than expected when their prices are rising and worse than expected when their price is falling. As with baseball, it’s kind of hard to really quantify hot streaks in basketball. However, when things are going good for shooters, they seem to continue to go good up to a point. The Plus/Minus shows a notable change, but looking at raw points makes it clearer.

When the price has risen by $500-plus in the shooter group, they average 28.27 DraftKings points per game against 23.19 when the price has fallen by that same amount. A difference of a little over five fantasy points per game is pretty significant over hundreds of results.

What made the most difference was the opposition. For all players, the worst team to go against last season was the Utah Jazz, who allowed a -1.51 Plus/Minus to opponents, and the most favorable opponent to face was the 76ers, who increased Plus/Minus by +0.54. So the difference between the worst and best matchup was a shade over 2 points.

Here were the worst teams for 3-point shooters to face:

3dep5


And the best:

3dep6


The difference between facing the Clippers and Wizards last season was a little over 7 points in Plus/Minus!

In conclusion, if you’re going to roster someone whose 3-point shooting accounts for such a large percentage of their overall fantasy production, take a minute to consider the situation. By looking at recent price fluctuation along with the opposition, you have the tools you need to identify shooters in optimal situations.