Before the season, I wrote an article about the most important statistics in D/ST scoring. I also did the same thing for quarterbacks, but then wrote a Part 2 where I juxtaposed the correlation between QB stats and DraftKings scoring and whether they were priced into QB salaries or not. The distinction is important – for example, knowing that average passing yards per game is an important statistic for QBs is fine, but it doesn’t really help you that much if DraftKings values it in their pricing as much as the correlation implies.
As such, we should look at statistical correlations next to pricing correlations and see where the discrepancies are. From there, we can find value.
While I wrote that Part 2 for QBs, I realized that I never did the same for D/ST. So without further ado, here’s a graphic of those stats:
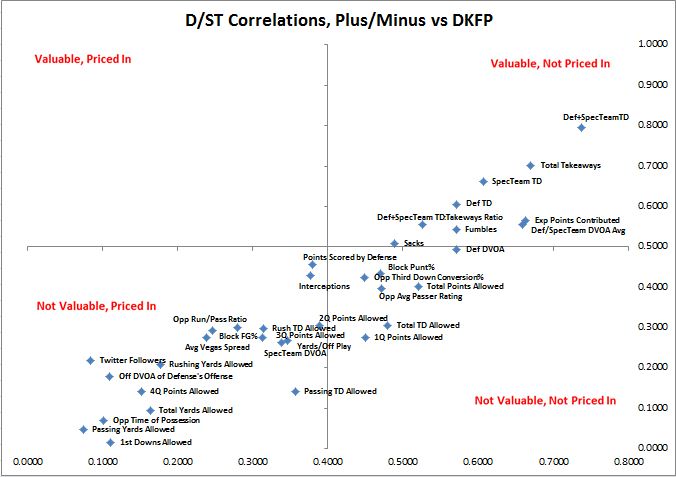
It is interesting that we don’t see really any statistics in the upper left quadrant – statistics that are valuable and priced in – and I think that is because of how DraftKings (and really all sites) price their D/ST’s. The difference between the top WRs and the worst WRs in any given week is between $6,000 and $6,500. However, that same difference in D/STs is generally only around $1,000. That means while there could be a big difference between the top and bottom, just like any other position, we aren’t going to see it “priced in” as much as a result.
This is an interesting find and I think the graph shows us two important things, which I’ll detail below.
- The “ST”, or Special Teams part of the D/ST, is generally undervalued.
Especially in GPPs, the D/STs that are racking up a lot of points – and when tournaments are so top heavy and are separated by a tenth of a point, this stuff matters – are ones that are pressuring the quarterback, getting turnovers, and scoring special teams touchdowns.
Unfortunately, the latter of those three things is really hard to predict. Sure, it does make sense to target D/STs with return specialists – think the Cardinals with David Johnson or the Rams with Tavon Austin – but outside of that, it can be random. However, getting pressure on the quarterback, forcing turnovers, and targeting defenses going against quarterbacks who turn the ball over a lot – those things are very predictive.
There’s also a market inefficiency in valuing the special teams part – most users look at the Vegas lines or just know which defenses are good by real-life measure and pick those as the last thing to fill in a lineup. This is accentuated by the pricing – people assume that because there isn’t a huge difference in pricing between the top and bottom D/STs that there isn’t a huge difference in their potential range of outcomes. That’s not true and you can use that to your advantage.
- There isn’t a statistic that is both valuable and priced in.
This is important because it draws a very distinct line for us – there’s no gray area here. With other positions, there are stats that are valuable and some are priced in while others aren’t. With D/STs (and again, I think it’s because the range in pricing), we have nothing in the upper left quadrant. Because of this fact, you can really just focus on the bottom right and upper right quadrants and base your research on those statistics.
For example, you can see that Vegas spread (this actually goes with the first point above) isn’t particularly valuable in predicting D/ST scoring. I would assume that the vast majority of DFS players would find this surprising – I really do believe most users pick defenses by this thinking: “The Patriots are really big favorites this week, so their D/ST must be a really good play.” And while that may be true for other reasons, it isn’t because they’re big favorites. This information can really be used in both cash games and GPPs – any edge is an edge in a game of skill and even a slight edge in picking D/STs can really increase your ROI if you do the proper research and make sound decisions based on valuable data.


