
The Masters is somewhat of a hard DFS tournament to analyze, as odd as that may sound. Odd, of course, because it’s common knowledge that The Masters is perhaps the “most predictive” golf tournament in the world – we have decades of data on it, it has kept the same course, and even hole placements. However, while the data for The Masters in general may be rich, that isn’t the case for DFS purposes.
The reason is that we always look at stats here at FantasyLabs by the Plus/Minus lens. If you aren’t sure what I mean by that, Plus/Minus is a metric that we use very often – it is actual fantasy points minus expected fantasy points (based on salary). The reason it is more useful than a simple stat like DraftKings fantasy points per contest is because it takes salary into account when analyzing players, something that is obviously important when a contest is based around, you got it, a salary cap. Sure, Rory McIlroy scores more DKFP’s per contest than other golfers, but he’s priced accordingly. That matters.
This brings me back to the data for The Masters this week. Again, we have so much available data on the course history and everything about the tournament; however, we only have Plus/Minus data for the last couple of years – really, since daily fantasy golf’s existence. So while we know what’s typically important for The Masters, it may not be the case after DraftKings has set salaries. Or put more simply: if something is really important but perfectly priced in to salaries, we can’t really find an edge in that stat.
Neil Paine of FiveThirtyEight.com did a study a couple years ago looking at what’s important for The Masters – of note, driving accuracy doesn’t seem to be really important, as historical winners have been under tour average in this category. Another example is putts per round (PPR in our models and trends), which has shown to be the second-least consistent indicator of success at Augusta, ranking only behind sand saves, which has a fairly small sample considering the robustness of other Masters data.
What was Paine’s final conclusion? I’ll quote him here:
So what does matter when predicting whose Augusta performance will exceed expectations? The only two skill statistics I found to be significant were average driving distance and the percentage of greens hit in regulation. Neither effect was huge, but you can see them come into play in recent Masters outcomes.
These are two stats that we have Plus/Minus data for – even though it’s only two years’ worth – so let’s take a look at what we can find using our Trends tool. First, let’s establish some baselines. We’re going to break players up into three salary tiers, as shown below. Also, let’s look at those players’ Plus/Minus before adding any additional filters – because PGA DFS is so course driven, it’s important to establish this baseline for data before adding other variables.
$9,000 or more: -5.14
$7,000 to $8,900: -5.82
$6,900 or less: -9.41
Already we can see that Plus/Minus’ are highly negative at Augusta. Next, let’s look at the Plus/Minus’ for each tier for a variety of stats – Adjusted Round Score, Greens in Regulation (GIR), Driving Distance, and Driving Accuracy – and look at both recent and long-term form. The Plus/Minus’ shown are the golfers who are above tour average in these categories. Here’s the table:
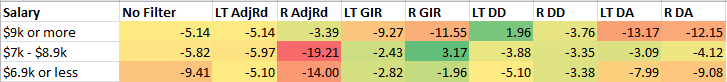
What stands out? Interestingly, this matches up quite well with Paine’s findings. Let’s go through each one quickly.
Adjusted Round Score: The long-term adjusted round scores were very consistent with the average Plus/Minus’ of those salary tiers, with the exception being the lowest salary tier. My hypothesis here is that these golfers were just mispriced. Recent form for the elite golfers slightly raised the Plus/Minus, but it was grossly negative for the other two salary tiers. As a result of the data, I would limit the weight on this stat except for grossly underpriced golfers.
Greens in Regulation (GIR): This is a bit surprising, as the elite golfers with above-tour-average GIR numbers – both long term and recent – have not fared well recently according to Plus/Minus. However, GIR seems to be incredibly important for the mid and lower tiers. In fact, the +3.17 Plus/Minus shown for recent GIR in the middle tier is a massive +8.99 higher than those golfers without this filter. While anything can be a small sample because Plus/Minus is only applicable for the last couple of years, since it matches up with Paine’s data as well, I’m inclined to weigh GIR heavily this week, and especially with the value plays.
Driving Distance (DD): Driving Distance proved to be very positive for every tier in both the long and short term. The second-highest Plus/Minus overall (+1.96) out of all of these variables studied is with elite golfers who have been above tour average in long-term Driving Distance. This one is easy: weigh Driving Distance heavily for all golfers.
Driving Accuracy (DA): Driving accuracy slightly improved Plus/Minus’ of golfers in the middle and lower tiers (very slight in the latter’s case), but it was grossly negative for the elite golfers. I would personally avoid this, although I’m fine with integrating into models if you are willing to adjust your models throughout the week and see how moving the sliders affect different players. For example, you can weigh DA heavily in a model momentarily to see who comes out high among the cheaper players, but weigh it less heavily when optimizing for your final lineup that will include elite players.
Of course, these are just four stats, albeit important ones. In our Trends tool, you can query the Plus/Minus’ at Augusta National for golfers in any salary range for a variety of other statistics – putts per round, birdies per round, missed cut percentage, par 3 scoring, and the list goes on. Dig into the wealth of data in that part of the site and do your research – the GPPs this week for The Masters are huge, meaning the reward for researching and nailing a lineup are massive as well.
