
To Say “I Don’t Want to Go Down the Rabbit Hole” is to Step Into Said Rabbit Hole
I definitely don’t want to go down the Ezekiel Elliott and Dallas Cowboys rabbit hole. We have already discussed that quite a bit here at FantasyLabs, courtesy of Matt Freedman and Jonathan Bales.
The main thing that stood out to me in their articles was something that has been brought up many times on Twitter and that (I think) the Cowboys completely missed: The danger of correlations.
We all know the phrase “Correlation does not equal causation.” The Cowboys thought that there was a strong correlation between a top running back (DeMarco Murray) and a top running game (that same year), so they reached for Zeke in the 2016 NFL Draft in an attempt to replicate that correlation. The data, however, has shown that a team’s success running the ball has to do with many factors other than the running back, the biggest of which [Editor’s Note: Literally] is offensive line.
Pacing Vigorously is How Some People Relax
Since the draft, Freedman and Bales have probably paced their living rooms in anger multiple times because they understand the difference between correlation and causation. Evidently, the Cowboys do not, but I can understand how they might’ve confused the two. Sometimes it’s hard to separate correlation and causation. Tyler Vigen actually wrote a book on this topic called Spurious Correlations.
He discovered some correlations that will probably surprise you.
Down The Rabbit Hole
Here’s a correlation that you might find intriguing:
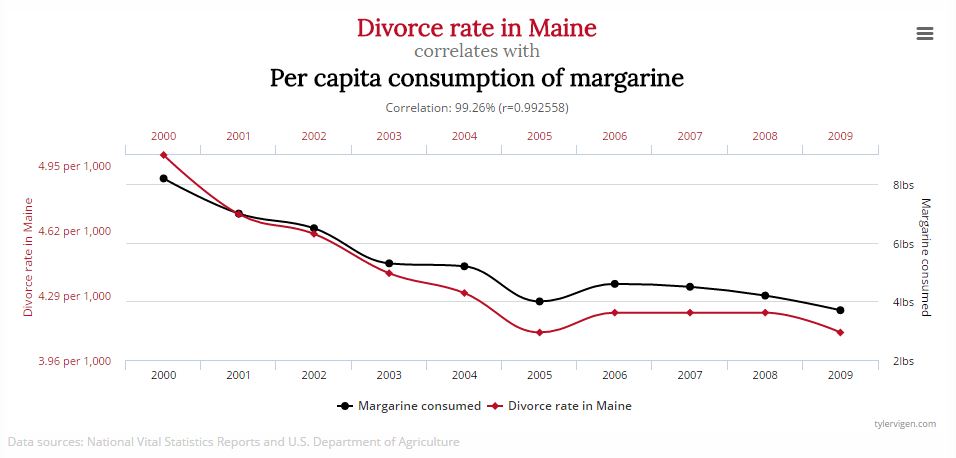
As you can see, the divorce rate in Maine is very highly correlated with margarine consumption. This one is easier than the Cowboys’ situation to figure out: This correlation does not equal causation. If people ceased to consume margarine, I suspect that people in Maine would still get divorced.
Here’s another one:
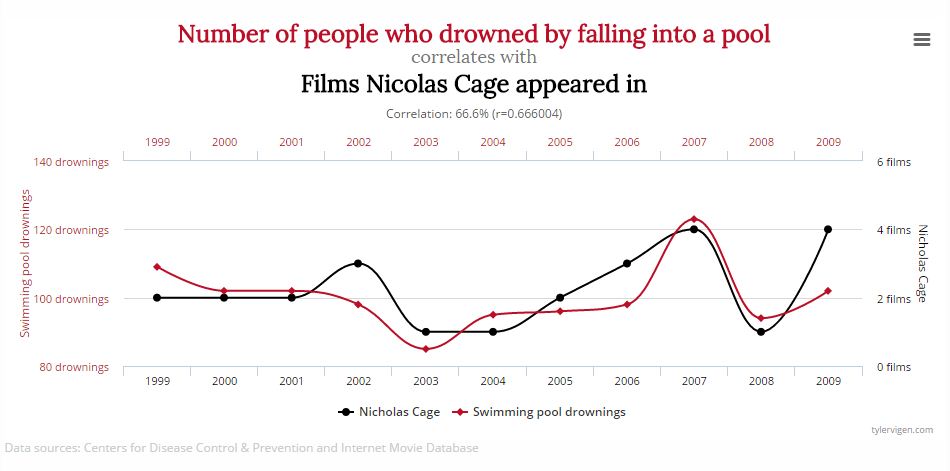
I know what you’re thinking: Causation. Calm down. I really doubt that Nicolas Cage’s acting leads to death by drowning. [Editor’s Note: But probably to the death of his career.]
Correlations happen all the time. Because all the daily fantasy sports — and our Trends tool and Player Models especially — are full of data, we often encounter patterns and then need to determine if the relationships in those patterns are correlative, causal, predictive, or just random.
For instance, here’s the chart that I posted last week in my piece on the impact of Vegas line movement on batters. In that article, I found the Plus/Minus for every batter for every Vegas line movement between 3 and 5.5 runs.
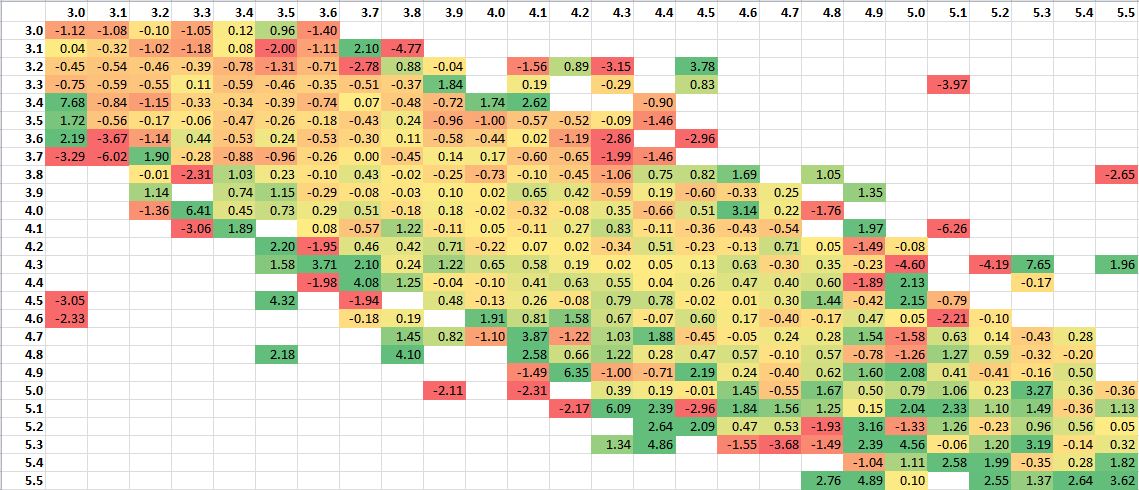
The data shows that when a line moves from 4.2 to 5.1 runs, batters have a Plus/Minus of -2.17. However, when a line moves from 4.3 to 5.1 runs, batters have a Plus/Minus of +6.09.
Cowboy Correlations
Now our Cowboy Correlations (trademark pending) would suggest that when a live moves to 5.1 we should highly target batters who start at 4.3 and highly fade them when they start at 4.2.
You can see the silliness of this: A difference of 0.1 runs in the starting points shouldn’t cause the difference that we see in Plus/Minus.
A lot of reasons exist for why we might see correlation that really means nothing: sample size, sample representativeness, randomness, etc.
Our tools and data are very powerful and can help DFS players be profitable — but only if you use them correctly. It’s not always easy. Sometimes you must dig into the data and figure out what is predictive and what isn’t.
Here’s the advice I’m leaving you with: Don’t blindly accept everything you see in your DFS research. Always dig deeper and find out why the data or trend says what it does. Only then will you be able to withstand the allure of Cowboy Correlations (trademark still pending).


