For a limited time, our powerful DFS Trends tool is FREE to FantasyLabs users. This video from FantasyLabs Cofounder Jonathan Bales walks through how to use the Trends tool for any daily fantasy sport.
1) Creating a Trend
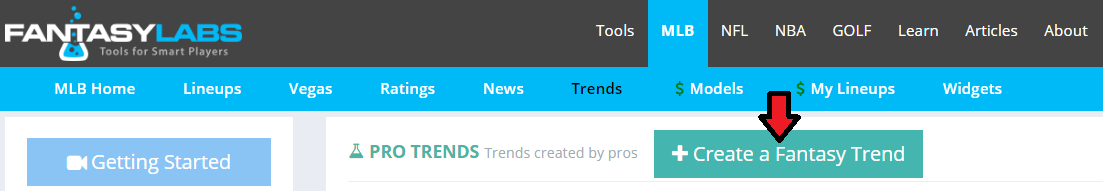
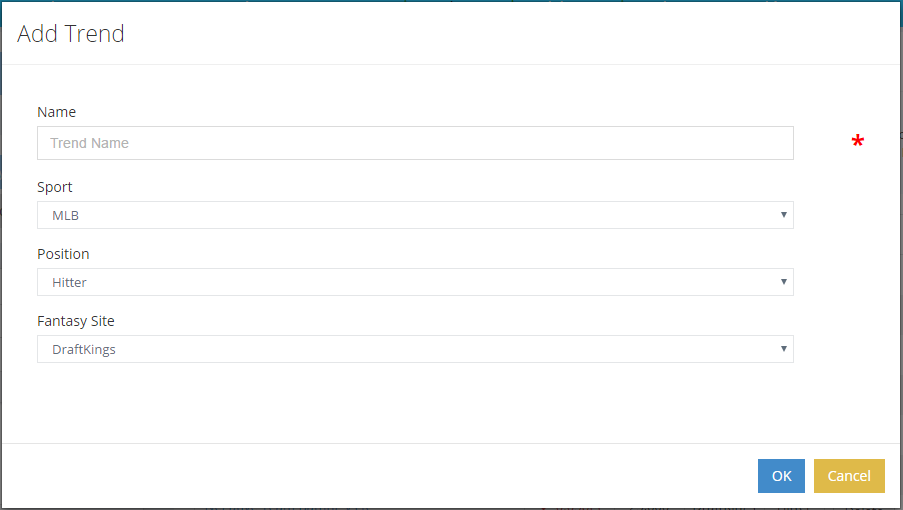
To create a trend, select “Create a Fantasy Trend” on the main Trends page.
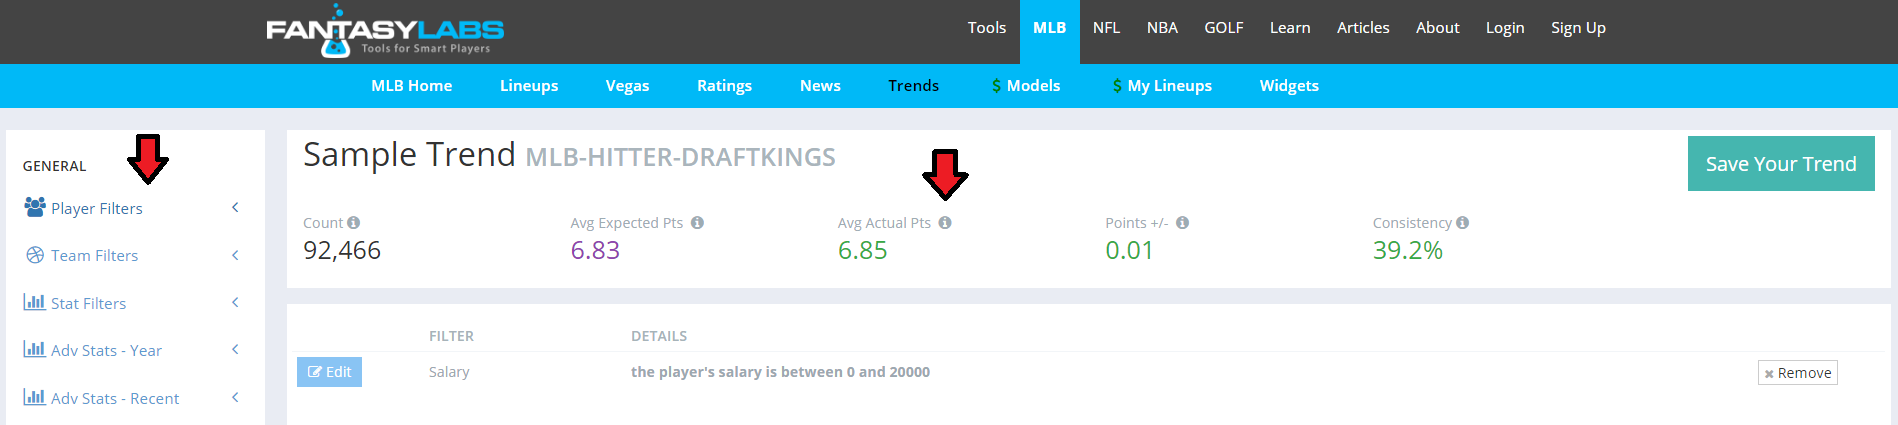
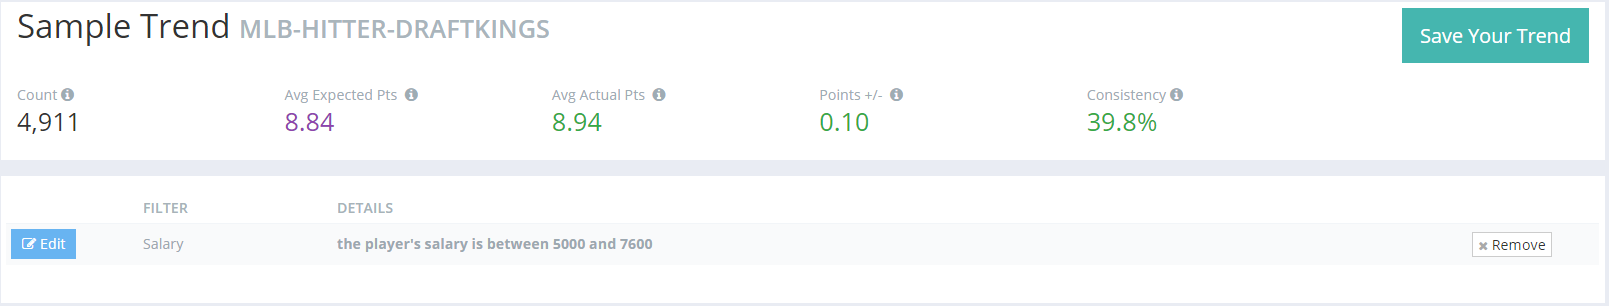
Count: The number of times the trend has occurred in the past (the sample size)
Avg Expected Pts: The average points expected for those players based on salaries
Avg Actual Pts: The average actual points scored by the players who match the search criteria
Points +/-: The difference between the two (actual points minus expected points)
Consistency: The percentage of times the trend meets or exceeds expectations
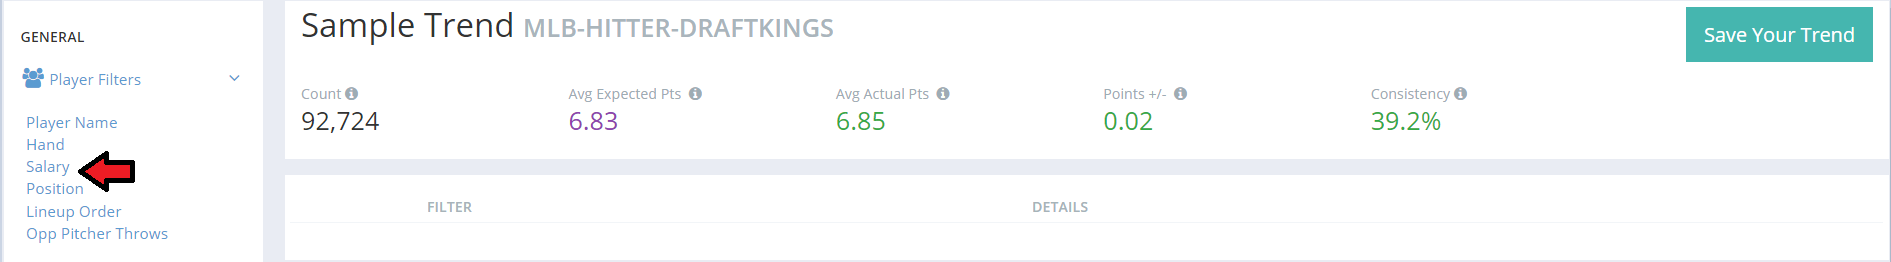
The top-left part of the page has a column that says “General” and lists filter options. This is where you will choose your filters to create your trend. Let’s create a sample trend.
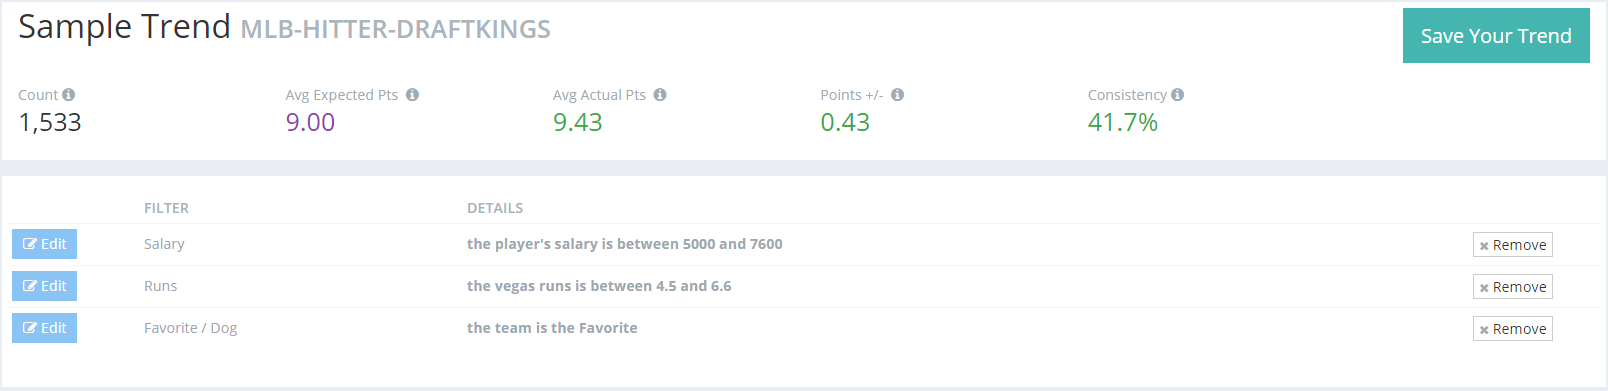
Let’s query how batters perform when they are 1) priced at $5,000 or more on DraftKings and 2) on a team that’s the favorite and projected to score 4.5 or more runs.
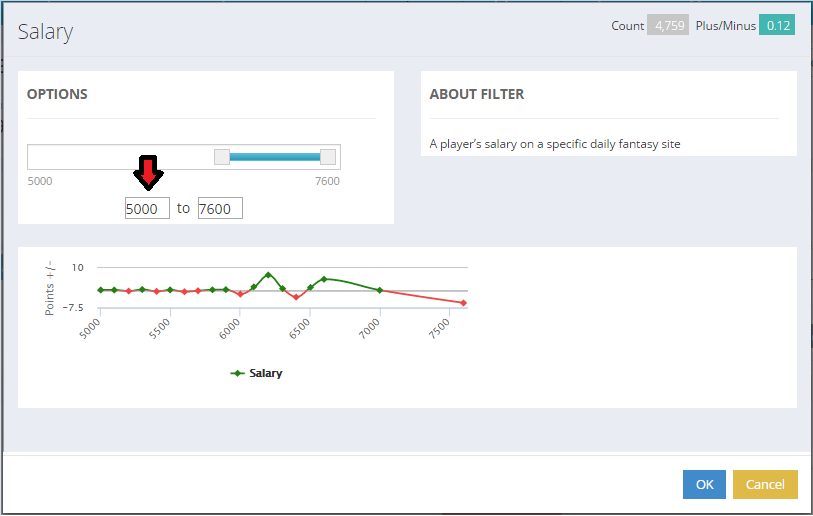
You will need to add three filters. The first one will be a salary filter, so select “Player Filters” and Salary” to start.
Let’s now look at the next two sections of the main Trends page: the 1) chart and 2) past results and current matches.
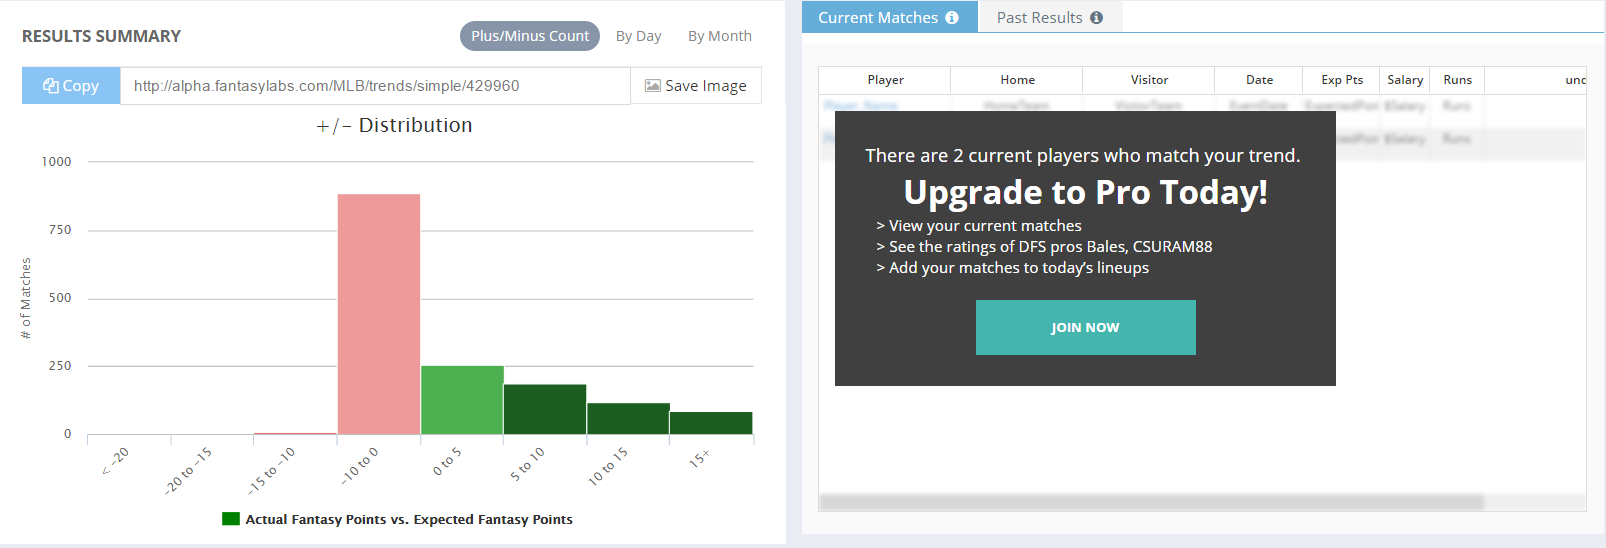
To read the chart, the height of the bar (or the y-axis) shows the count, or sample size, of the Plus/Minus distribution (the x-axis). You can hover over each bar to see the specific number count; for example, this trend has 838 historical “hits” of players scoring between -10 and 0 fantasy points under these conditions.
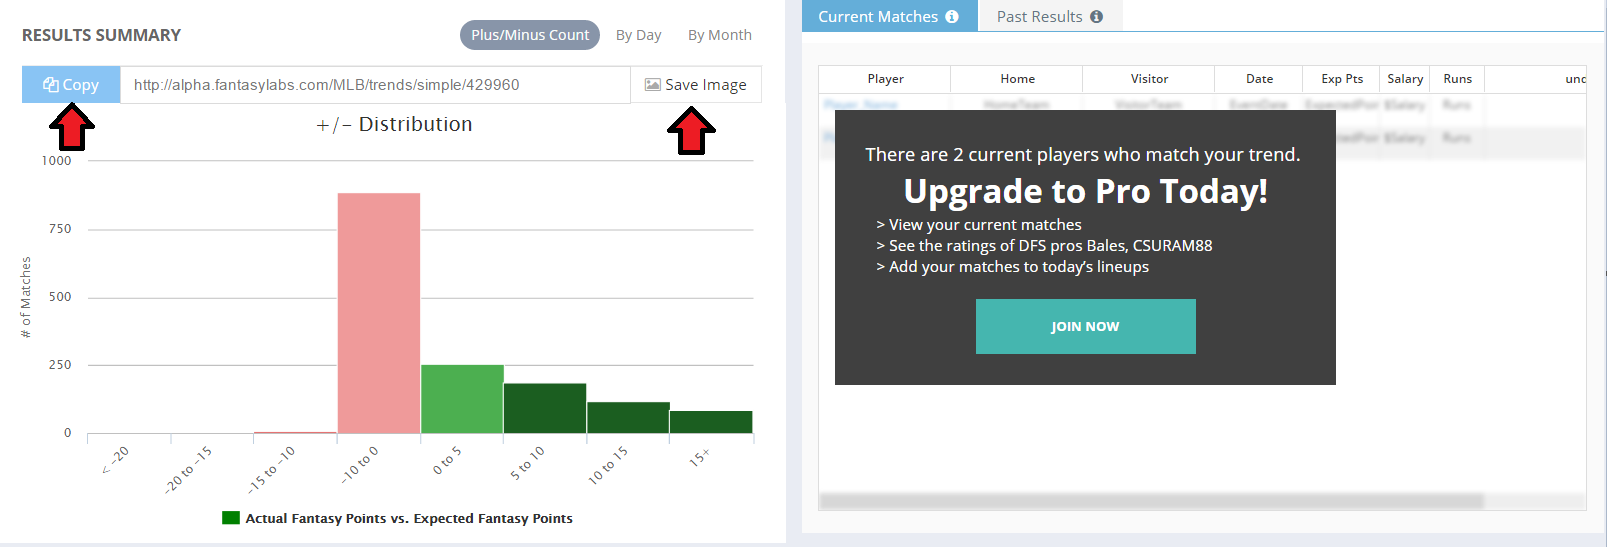
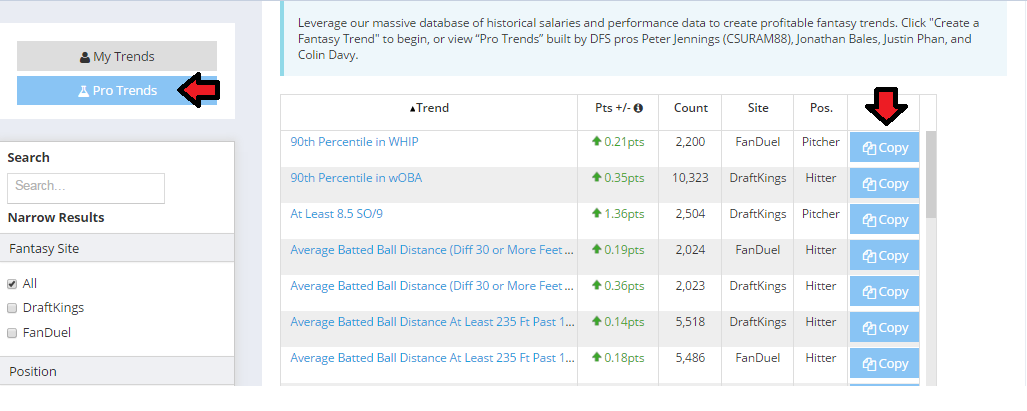
To share this trend, select “Copy” and share the generated link. To share the chart image, select “Save Image” next to the link.
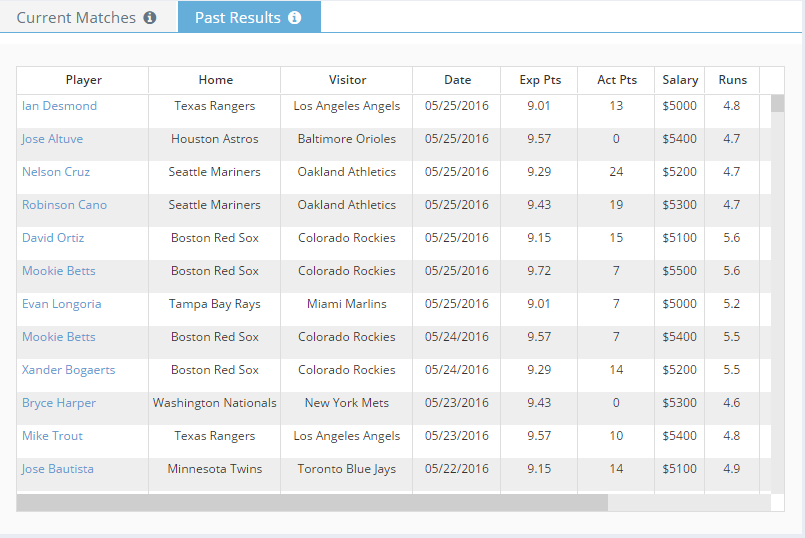
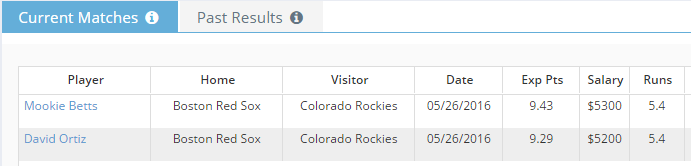
In order to view the next section, you must be a FantasyLabs Pro subscriber.
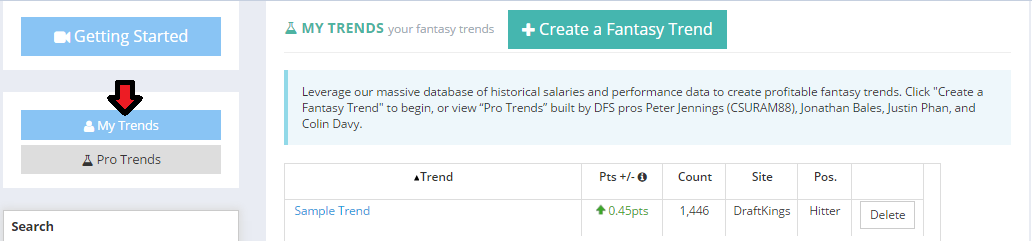
Congratulations! You have created your first trend. It is now saved under “My Trends” on the main trends page.
2) Plus/Minus
Plus/Minus is a unique FantasyLabs metric that is at the core of all of our tools. It is defined as actual fantasy points minus expected fantasy points based on salary. This distinction is important, as daily fantasy sports are played with a salary cap. We can only really know a player’s value when we measure his fantasy production in relation to his price.
As an example, a $5,000 batter on DraftKings might be expected to score 8.0 points. If he scores 10.0 points in a game, he’s turned in a Plus/Minus of +2.0. Plus/Minus is a way to put every player on an even playing field using historical salaries and performance data—something other sites cannot do.
Setting everyone on an even playing field is what makes our Trends tool so powerful; our Plus/Minus metric has eliminated the fantasy-point discrepancy that makes it impossible to find value. Instead, you can use our Trends tool to apply many different filters to create an essentially unlimited number of trends to provide hidden daily fantasy value, both historically and in the future.
3) Tips and Tricks
Tip 1: View “My Trends” in Player Models
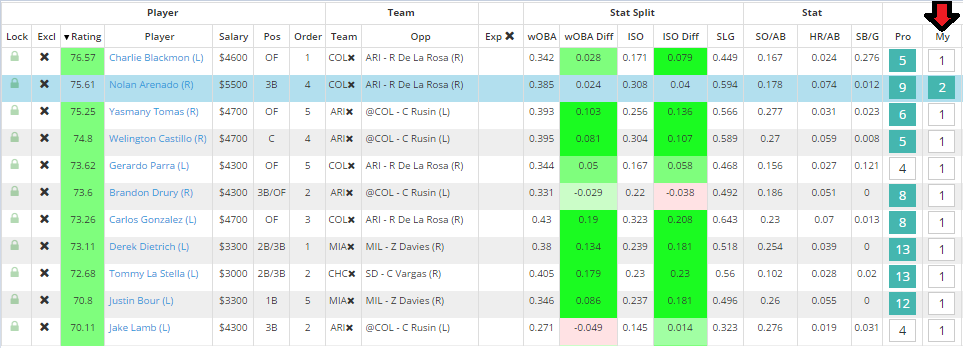
Once you create a trend, it saves under “My Trends” on the main trends page. These trends also show up in Player Models as a column. Click on the number to bring them up.
In general, the larger the count (or sample size) of a trend, the more confidence we have in the validity and predictability of that trend. Your sample trend above had a count of 1,446 batters. With a count that high, we can be reasonably sure that the Plus/Minus value we’re viewing is indicative of the trend.
Because there are so many filters, it can be enticing to use several on a single trend to boost the Plus/Minus as high as possible.
For example, I have added several more trends to our sample one above. The following trend shows batters who (like your old trend) 1) are at least $5,000 or more on DraftKings, 2) projected to score at least 4.5 runs, and 3) on the favorite. However, this trend also filters down the player pool to those who 4) are playing on a Sunday, 5) on the visiting team, 6) have at least 10 Pro Trends, and 7) have a Bargain Rating of at least 50 on DraftKings.
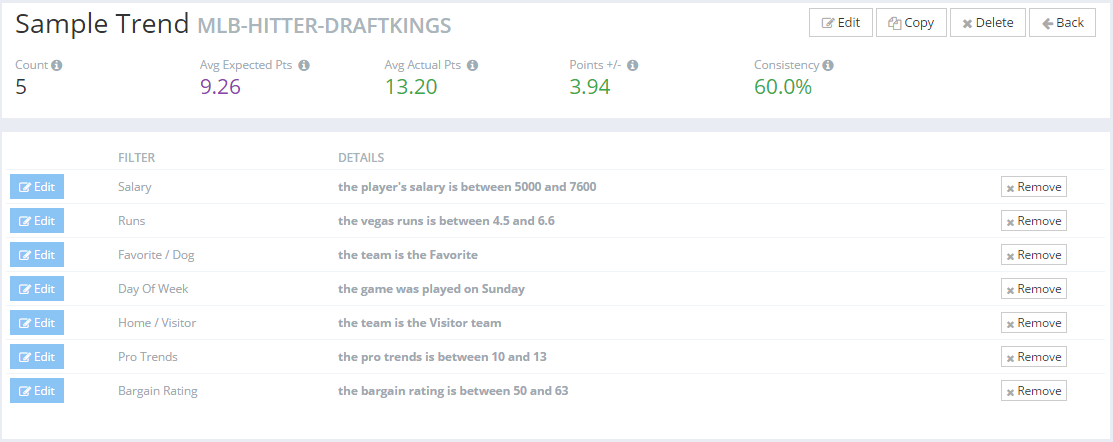
The lesson here is: Keep it simple. Stick to trends with high samples.
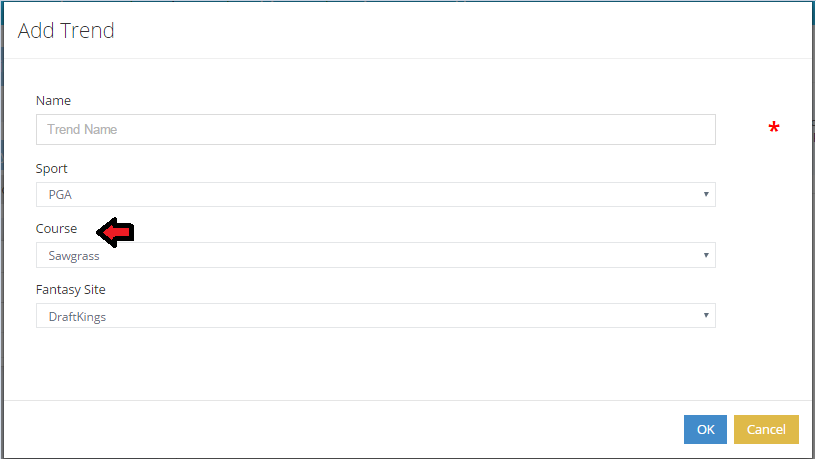
Tip 3: Choosing a course in PGA Trends
Our PGA Trends tool allows you to select a course as the basis for your trend.