
MLB Trend of the Week: Temperature Effect by Stadium
If there’s one thing we can count on with spring baseball, it’s unpredictable weather. In a general sense, we’re aware that things like precipitation and wind can affect our MLB DFS teams, but we probably don’t take it quite far enough. It can often be difficult to separate weather from venue, but that’s exactly what I’m going to do here through the use of a couple custom trends courtesy of our MLB Trends tool. We’re going to take a slightly different approach than we normally do with Trend of the Day or Trend of the Week articles, but we will ultimately end up in the same place, so bear with me.
Batters
In an attempt to separate weather (specifically temperature in this article) from the stadiums themselves, I first noted the baseline Plus/Minus value for each stadium. This is the average production for all hitters above or below expectations by stadium with no other filters. In the below table, this column is labeled “Overall”.
Next, I broke down batter Plus/Minus by each temperature range, increasing in increments of 10. The columns labeled “DIFF” represent the difference between the overall Plus/Minus of that ballpark and the Plus/Minus of the temperature range immediately to the left of the “DIFF” column. Please note that you can click the image to view a larger version.
I used FanDuel for all queries in this article because the database of results goes back further.
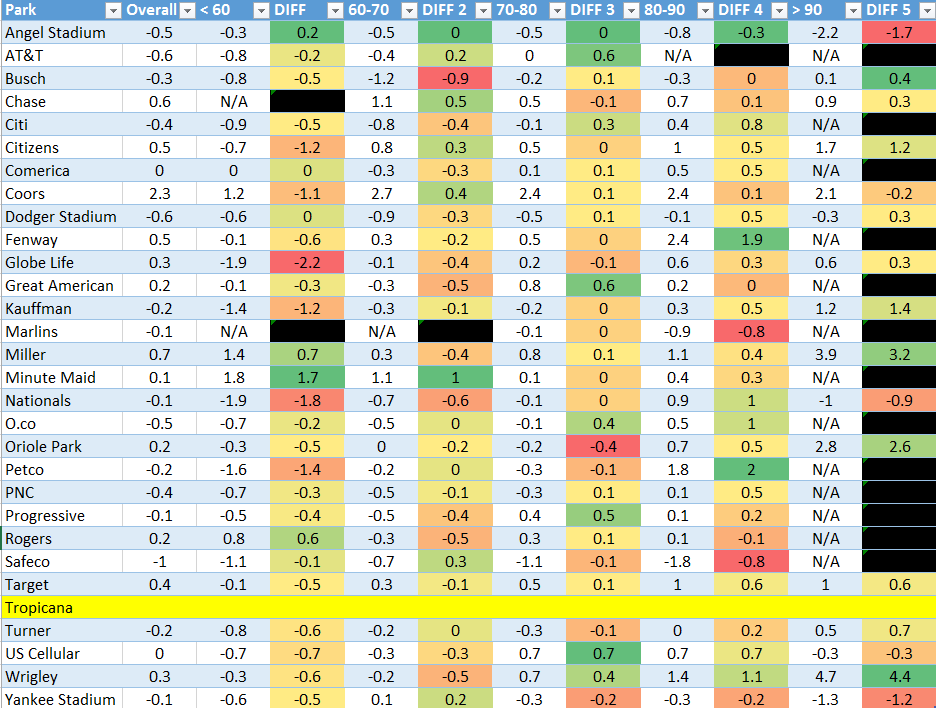
*Note – Tropicana is highlighted because this stadium has a non-retractable roof.
Now, the first thing you need to be aware of is that the sample sizes vary greatly square to square. There are far more games played in 90-plus degree weather in Arlington, Texas, than in Boston, Mass., for example. If there was a truly small sample size, I blacked out the square. If you want to setup a couple custom trends based off of this data, check the sample size first.
Let’s look at a few things that stick out before setting up any trends. In the “colder weather” category, in games played in a temperature under 70 degrees, Minute Maid Park leads the way in terms of Plus/Minus. That’s interesting because this stadium has a retractable roof. The large majority of games in this result set were played at 72 degrees, which is the constant value we assign for a game played in a dome.
This could mean that Minute Maid Park plays better with the roof open than when it’s closed, even when the weather is cooler, which is generally unfavorable for hitters. As I mentioned, there have been far more games played with the roof closed, so there is some sample size concern here. Still, I think this is one to keep an eye on.
On the other end of the spectrum, hitters playing at Globe Life when the temperature is 60 degrees or cooler have collectively registered a -1.92 Plus/Minus. This is over two full fantasy points per game worse than Globe Life Park’s +0.3 Plus/Minus baseline. It’s safe to say that you should generally think twice about playing batters here in cooler weather.
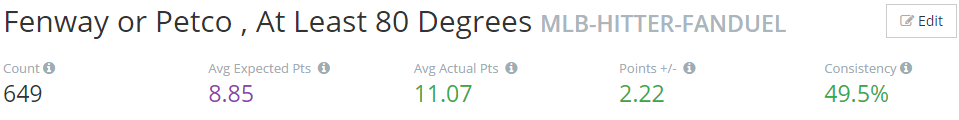
As for hot weather, Fenway and Petco have stood to gain the most value when it heats up. If you don’t think the temperature is important, just look at the range of outcomes at Petco Park: You’re looking at anywhere between a -1.6 to +1.8 Plus/Minus based solely on how hot it is!
There are a lot of things you can do with this data and I’d implore you to think about how you can leverage it into your own custom trends. Let’s go through one example now. I’m going to combine Fenway and Petco together and create a Trend that will alert me anytime a game will be played at one of these ballparks and the temperature is forecasted to exceed 80 degrees.
Step 1 > Team Filters > Stadium > Select “Fenway” and “Petco”
Step 2 > Weather Details > Temperature > Set “80-100”
Pitchers
Of course, that’s only half the story! Now, let’s do the same thing for pitchers. Here is that same table, this time with pitcher values:
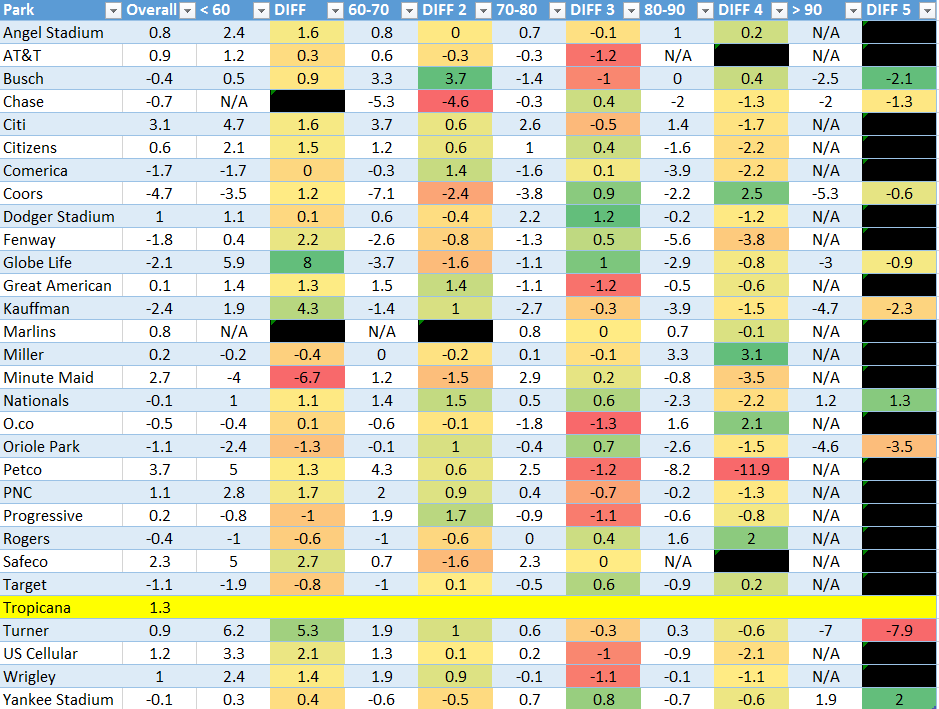
We saw that Fenway and Petco become better spots to play for hitters when it’s warm, so it makes sense that pitchers lose value under those same settings. Wrigley and US Cellular both seem to follow a similar trajectory (makes sense, as they’re in the same city).
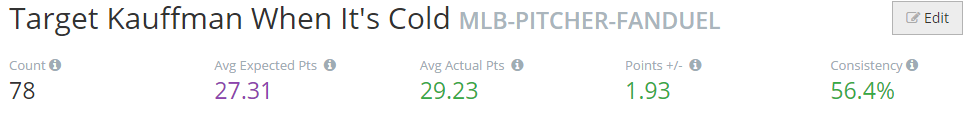
Let’s look at Kauffman Stadium next. When it heats up in Kansas City, it’s actually a good spot for batters. In the cooler weather though, this is a place where pitching rules. We’ll go ahead and setup a Trend that will allow us to target pitchers at Kauffman when it’s 60 degrees or cooler.
Step 1 > Team Filters > Stadium > Select “Kauffman”
Step 2 > Weather Details > Temperature > Set “40-60”
Conclusion
Ballparks play differently depending on the weather. This is often hard to separate, but that’s what our Trends tool is for. In addition to temperature, wind and precipitation filters could be applied in a similar fashion. Remember to experiment with the settings: An 81-degree day is probably not going to be that different than a 79-degree day, although they would fall into different boxes in the table above.
