
With the NFL season in the rearview mirror and the MLB still a few months out, I decided to try my hand at some PGA DFS. This was tricky, though – I’ve never watched a round of golf in my life. However, I thought it would be an interesting puzzle to solve.
Would it be possible to have success at a DFS sport in which one has no knowledge?
Four weeks into my PGA DFS “career” (playing one lineup per week), I’ve cashed three times in GPPs, including a top-10 finish in a 1,400-person contest. While a huge amount of luck and positive variance went into this, I was able to put myself in a position to benefit from that variance.
This is all thanks to the FantasyLabs data in the PGA Player Models, articles, PGA DFS Sims, and tools. I’ll tell you how I did it, how you can too, and (most importantly) how to apply these lessons to any DFS sport.
Use our PGA DFS SimLabs Lineup Generator that creates advanced DFS lineups using the power of simulation.

Predictive vs. Descriptive
The most important step in DFS is differentiating between metrics that are predictive and those that are descriptive. Primarily descriptive metrics are things like fantasy points scored in any sport, touchdowns in football, or batting average in baseball. They tell us what has already happened.
Crucially, DFS pricing (and, to an extent, ownership) largely hinges on descriptive stats. (Though this is a bit of a feedback loop – DraftKings seems to raise salaries on highly rostered players even if their performance isn’t spectacular.) Therefore, any benefit we could get from analyzing these statistics is largely baked into the price.
On the other hand, predictive stats tell us what is likely to happen next. Things like batted ball data in baseball, air yards in football, or usage rate in the NBA. These statistics are forward-looking and thus generally aren’t accounted for in player salaries.
Of course, data exists on a continuum between these two extremes. Using football as an example, a receiver who scored more touchdowns last season is somewhat likelier than one who didn’t to repeat that this year. Some players consistently accumulate a high number of air yards relative to their production, and so on.
However, over the long run, we want to base our lineups on statistics that lean towards the predictive side of things. That was my goal with golf.
Let’s talk about what those statistics are.
Putting is Random
Before you get worked up over the title of this section, hear me out. I was fortunate to get to pick the brain of Justin Bailey – FantasyLabs and RotoGrinders Lead Editor and world-renowned (probably; I don’t know anything about golf) PGA DFS mind.
While tilting about my golfers missing eight-foot putts, he explained that making putts is relatively random (also, he mentioned the make rate from eight feet is about 50% for TOUR pros). While skill factors into it (more on that later), on any given day, whether a putt falls or not is hard to predict.
My thesis then was how do we separate players that have been playing well but were on the wrong side of putting variance. Those golfers are likely to be cheaper and possibly lower owned than they “should” be based on their actual abilities.
Fortunately, the answer was within our PGA Models. While this may not be news to golf fans, “Strokes Gained: Tee-to-Green” was exactly what I was looking for. It’s simply a measure of how well a golfer has done in all of their shots except putts.
This is the perfect starting point for lineups. Using the long-term version of this metric (SGT2G in the models), I look for golfers who are some combination of cheap in salary or have low ownership relative to their score.
Using our Trends tool, we can see how well that works:
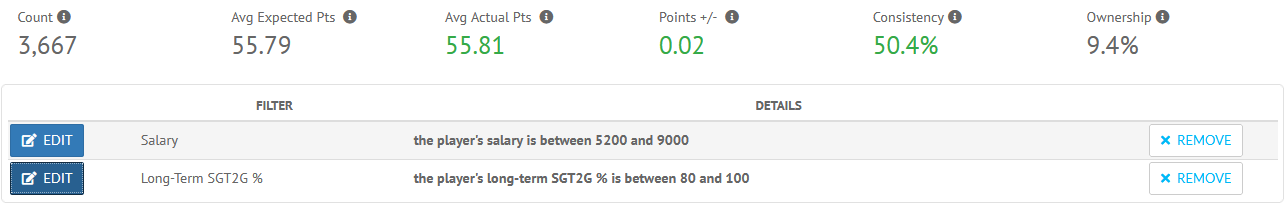
While the Plus/Minus doesn’t seem great at first, all golfers under $9,000 average -1.65 Plus/Minus, so it’s a marked improvement. Golfers over $9,000 in salary exhibit a similar trend. Those golfers (in total) have 16% ownership and a -2.0 Plus/Minus.
When we filter only for those in the top 20% of long-term Strokes Gained: Tee-to-Green, we get an extra quarter point or so of Plus/Minus.
(Which further lends credence to the idea of rostering cheaper golfers who’ve underperformed their SGT2G metric.)
Strokes Gained Differentials
Here’s where things get interesting. Our models also provide “Form Differential” data – the difference between a golfer’s long-term performance and recent. This is where we want to look for players who’ve had a bad run putting-wise.
(Negative numbers indicate worse performance recently relative to their baseline.)
If putting – at least in the short term – is truly random, players who putted poorly recently likely had worse scores than their true ability would indicate.
This means lower prices and lower ownership.
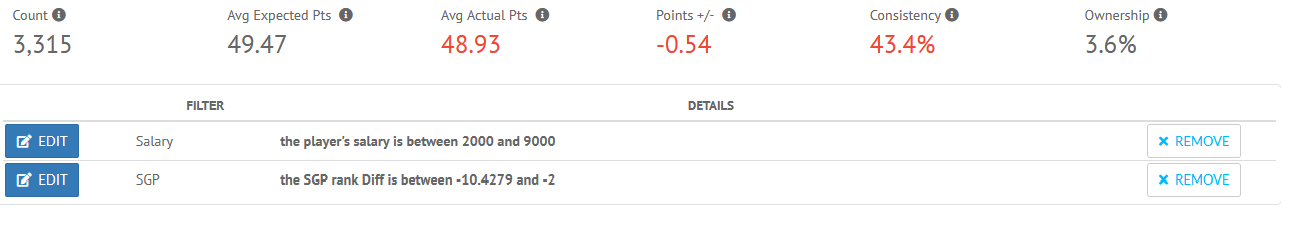
Remember, the baseline Plus/Minus for sub-$9,000 golfers is -1.47, so this represents nearly a point better, at no cost to ownership. What’s even more encouraging, though, is the “upside” rating jumps from 3% to 5%. These golfers have a ton of upside if some putts can break their way.
Putting it Together
Finally, let’s look at what happens when we combine the two metrics. Golfers who hit the ball well in the long term but have putted poorly recently:
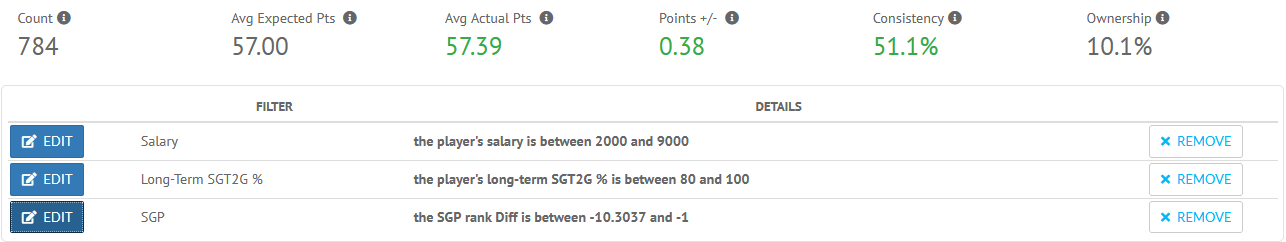
Bingo. I loosened the restriction on putting differential in order to increase the sample size, but the data is even more telling if you hold to the -2 threshold. This trend gives us seven golfers to consider for this week’s contest. Allowing us to roster the few that fit our builds and have reduced ownership projections.
I also use our Perfect% and SimLeverage metrics to put in a few contrarian pivots into my lineups.
While a more nuanced approach may pay even more dividends, that’s up to you to decide.
Generalizing to Other Sports
I can’t stress enough how little I know (or care, though that’s beginning to change) about golf. I’m well aware that I had some positive variance that led to my early success. (I’m also fortunate to be able to pick the brain of a true DFS golf expert.) However, that doesn’t mean the process wasn’t sound.
So long as you can figure out which metrics predict future success, this can be applied to other sports as well. The edge you’re able to find inversely correlates with how popular the DFS sport is as well. This kind of analysis is common knowledge for NFL DFS, for example.
Less popular DFS sports like esports, tennis, and NASCAR (or Formula 1) offer more fertile ground for lesser-known edges.
Hopefully, I’ll be able to find success in one of those sports and report back my findings, but if you have a FantasyLabs subscription, you very well may beat me to it. (DMs are open on Twitter if anybody wants to teach me about NASCAR.)
None of this would be possible without the wealth of data in the FantasyLabs Models though. Being able to pick through and backtest each metric would take many hundreds of hours without the FantasyLabs tools.
And don’t forget, for large-field tournaments, you can utilize our PGA DFS Sims or Lineup Optimizer to effortlessly create multiple lineups. Or use our Lineup Builder if you like to hand-build your teams.
See you at the top of the leaderboards.
Pictured: Hideki Matsuyama
Photo Credit: Getty Images
YOU MAY ALSO LIKE
 BMW Championship PGA DFS Stats Preview: Course Fits, GPP Picks, and Values
 TOUR Championship Top PGA DFS Picks, Values and Sleepers for Large-Field GPPs on DraftKings
 Ryder Cup PGA DFS Picks and Values on DraftKings
 BMW Championship: Top PGA DFS Picks, Values, and Sleepers for Large-Field GPPs on DraftKings
