Usage rate is one of the most important statistics in fantasy basketball. If you can accurately predict minute load and usage rate for a slate, you’re going to be highly profitable.
However, I think there’s an edge to be gained if we approach usage rate a bit differently. Let’s start with the definition of the stat and work from there – a player can “use” a possession in three and only three ways: a made shot, a missed shot and subsequent rebound, and a turnover. As you can see, not all three potential outcomes are positive for the player and his team. In fact, only one is.
So why do we focus on total usage rate (or the percentage of possessions used by a player while on the court) when two-thirds of it by definition is negative? Why not divide usage rate into groups and call them “positive-” and “negative usage rates,” respectively? Well, let’s do it!
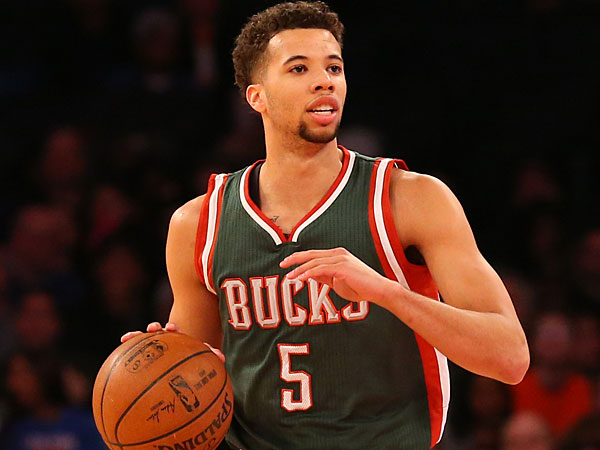
An example is Michael Carter-Williams, point guard for the Milwaukee Bucks. He has posted a high usage rate in his career, but a large portion of that has been due to turnovers. In fact, NylonCalculus.com provides this data right on their site – MCW “used” approximately 11.1% of possessions while on the floor by committing turnovers. So while he may have a higher total usage rate than another point guard, you can see that his positive usage rate is actually lower than others.
Even further, Nylon Calculus breaks a player’s usage rate into “scoring” and “playmaking,” which is very applicable to DFS. We’re always – especially in tournaments – trying to predict positive and negative regression for players on a given night. That way we can find a valuable player that is lower owned. A great way to do that is by looking at the breakdown of their usage rates and other SportVU-based metrics. John Wall, for example, could be dominating the game and dishing out perfect passes to his teammates, but if they’re missing wide-open layups, Wall’s brilliant passing and playmaking is of no use to us in DFS.
Except that it is – we know that players historically will make easy layups, and miss a larger percentage of contested shots than open shots, and other things. If we combine that knowledge with the SportVU and usage data, we can see when a player is bound for a positive or negative regression. If John Wall is getting Bradley Beal the ball wide open on the wing, eventually we’ll see that situation come to fruition in terms of fantasy points.
Usage rate is definitely an important statistic for DFS players, even just the raw version of it. However, since it’s defined by three separate situations, we can divide those up now with SportVU data and find inefficiencies in the statistic. And this is really important because when researching for DFS purposes, we need to find edges that are 1) valuable, and 2) not used by everyone. Point #2 is often forgotten, but just as important. Thinking of usage in terms of positive/negative is one way right now to check the box on both points.