wOBA = cash and ISO = GPPs.
End of story, right?
In the brief history of DFS I think it’s safe to say that wOBA has been the go-to metric for selecting cash-game hitters. And as it does a great job at valuing a hitter’s performance as a whole, it’s proven to be a very solid indicator of projecting the consistency we seek for cash games.
My only problem with this is, I’m not sure it actually is the best.
Now hear me out before hitting me with a barrage of disparaging tweets. I’m not saying that it was never true and not even that it isn’t still true in certain instances. But looking at the world of DFS as a whole, I believe there’s reason to consider utilizing ISO either in combination with or in place of wOBA for cash games.
If you’re already muttering to yourself and considering hitting the “back” button to get as far away from this article as possible, I get it. Baseball metrics are sacred territory to their ardent supporters. We hate change and we’ll generally do all we can to fight it.
Years ago it used to be commonplace to enjoy an afternoon drink while chain smoking at your desk – “the good old days,” per my grandfather. Try breaking out a bottle of Scotch and lighting up in your cubicle these days and see how kindly your employer takes to it (pro tip: you’ll likely be fired, so unless your workplace is a bar, please don’t actually do this). Eventually employers realized these activities may not assist in maximizing productivity (or their co-workers health) so now we don’t do these things anymore.
Maybe a little over the top, but the point is: times change and we adapt. As the information available to the public becomes more prevalent (and of better quality), we will continue to see cash lines rise in DFS games. Many have noticed this taking place in both NFL and NBA already this season and I believe MLB may be next.
As the public as a whole continues to better their DFS game, continual re-evaluation of our cash game strategy is important. For many, this has meant placing a higher value on the ceiling of a player than we may have in the past, due to the the margin of error growing ever smaller. Strategically trading off a bit of a higher floor for an increased ceiling – which can assist in “covering” for other positions in your lineup that may have faltered – is something worth considering.
Now, baseball, although highly variable, can be a more forgiving sport in that we can afford to have guys go 0-4 and still be competitive. But given what we’ve seen in the other mainstream sports, I think it’s at least worthwhile to examine the idea of utilizing a metric like ISO – which will assist in targeting players with higher upside – on a wider scale in cash games.
Before I start, let me preface this with the fact that we’ve actually examined this idea a bit last June – check out the article for a quick overview on each of the metrics if you’re not familar – however there wasn’t really a true “winner” established. wOBA proved slightly more consistent, while ISO proved to have slightly higher upside. I’m digging back into the topic now because we have an additional year worth of data available to us in our Trends tool database to work with.
ISO vs wOBA: Round One
I’m going to start by comparing two Trends; the first is comprised only of a single filter: ISO Percentile of 80% or higher. I chose 80% after playing around with both 85% and 90%. I determined that the results were very comparable to 80% for each of these percentiles as I went through the many steps you’ll find below, however our sample population was much greater by using 80%, thus (assumingly) lending more credibility to the results.

Now, let’s look at our second Trend, which will follow the same methodology as the first, but will utilize the wOBA Percentile filter.

So, identical Consistency rates and a slight edge in average Plus/Minus to ISO. These results are actually what drew me into the idea of this article to begin with. Theoretically, we should be seeing wOBA with at least a partial edge in the Consistency department – we are giving up the assumed ceiling associated with ISO by emphasizing wOBA after all. But we don’t. They’re identical.
I’m giving this round to ISO, as it (expectedly) displayed a higher Plus/Minus and surprised us by matching wOBA’s consistency.
Round One Winner: ISO
Overall Results: ISO 1 – wOBA 0
ISO vs wOBA: Round Two
The previous two Trends were actually utilized in the previous article comparing wOBA and ISO, but with only a year’s worth of data. The results above are great and all — a huge sample size and likely indicative of the population as a whole, but I wanted to dig deeper.
Just as we do when setting up a Trend in NBA, I wanted to try to define a way to consider the population we’re actively targeting. For NBA, I do this by setting a minutes filter to 25 for Trends focused on cash games. In a tournament, sure I’ll give a look to a guy who may only play 15-20 minutes, but for cash, I want those guaranteed opportunities to be on the court.
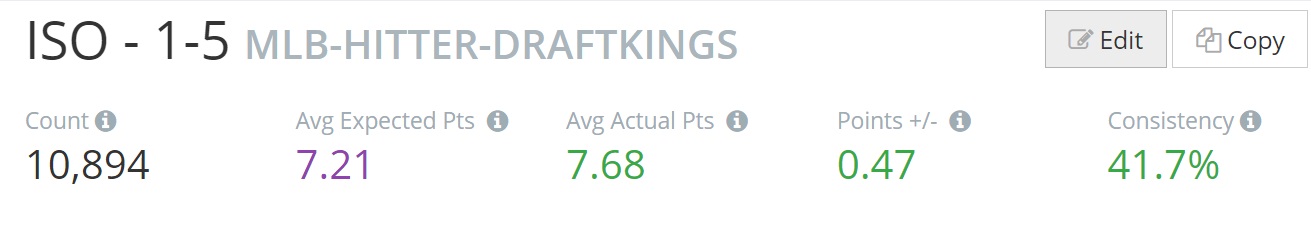
So what’s the MLB equivalent to minutes? At-bats. For cash games we want to maximize the amount of opportunities our players have and we can do so by actively targeting players in the 1-5 lineup spots. So that’s exactly what I’ve done to the Trends above, by adding a filter to only include those specific lineup spots.
First, we’ll look at ISO.
And next, wOBA.
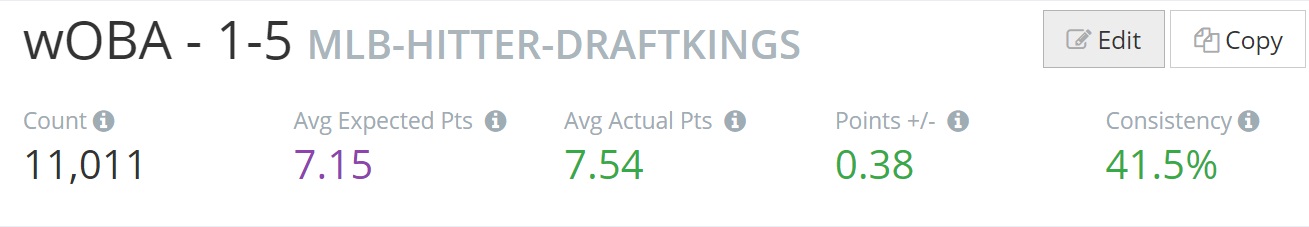
Once again, the Consistency rating is almost identical, but this time we see ISO really begin to shine. Not only does it have a very slight advantage on wOBA in terms of consistency, but it’s average Plus/Minus of +0.47 is 0.09 higher than wOBA’s.
I think the results speak for themselves this round.
Round Two Winner: ISO
Overall Results: ISO 2 – wOBA 0
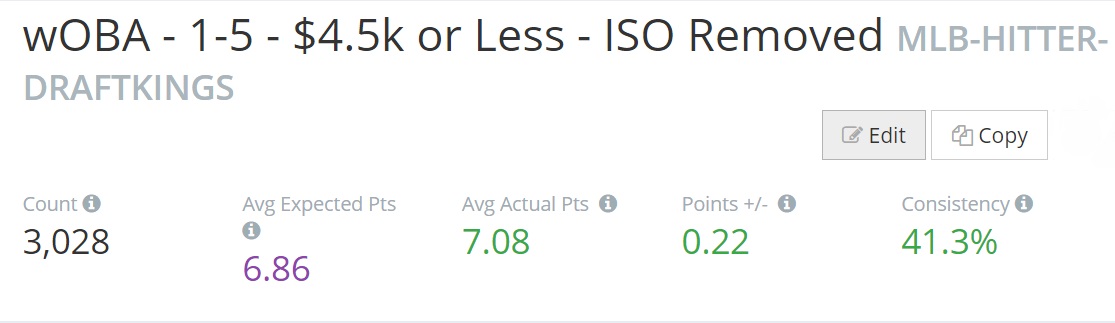
ISO vs wOBA: Round Three
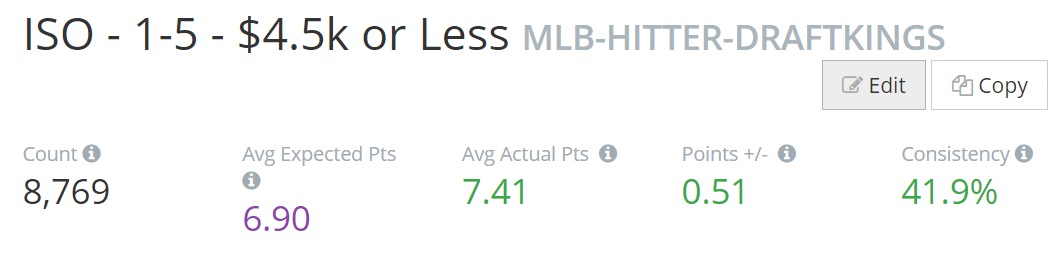
Because I’m trying to model these Trends as best as possible towards generally accepted cash game lineup construction principles, let’s remove the more expensive players from the equation. If you’re spending up on a reliable pitcher to bolster your cash game lineups, you may not have the funds remaining to spend up for the top tier hitters, so let’s examine our population without them included.
And again, the wOBA results.
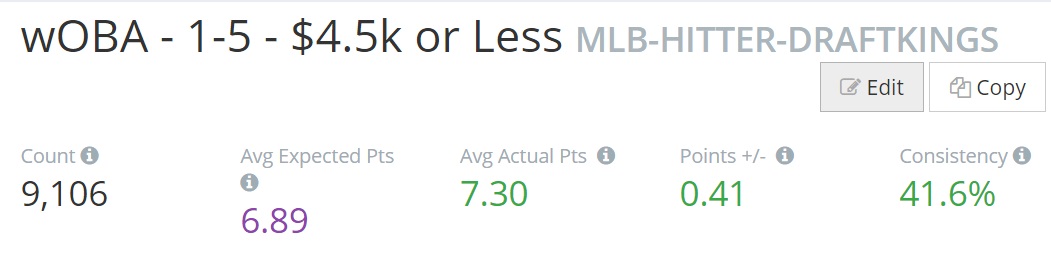
This is where I actually thought wOBA would shine, so I was surprised to see the gap grow even greater. As such, I think we have to score another round for ISO.
Round Three Winner: ISO
Overall Results: ISO 3 – wOBA 0
ISO vs wOBA: Round Four
This is it: the final round.
The one thing that had been bothering me about many of the results we’ve been extracting is that their populations shared a large amount of players. It’s no detriment to the data itself, it’s simply due to a large amount of the included population, being, well, good hitters. It makes sense that there would be a large amount of overlap between the two metrics. But in an effort to better gauge the validity of the metrics on their own merit, let’s remove the ISO hitters from the wOBA population and the wOBA hitters from the ISO population.
And let’s look at those wOBA results — the knockout blow, if you will.
Score another for ISO, this time in dramatic fashion. It should be noted, this final round is more anecdotal than anything. We don’t have to remove the top wOBA performers from our pool of available players or vice versa with the ISO players. But, these results clearly show the power of ISO.
Round Four Winner: ISO
Final Score: ISO 4 – wOBA 0
Recap
The numbers are blatantly on ISO’s side, but there is one thing we can’t fully capture with this data – the cumulative effects of a bunch of measly singles (or doubles, etc). These players may not be meeting value, but cumulatively, they may be enough to carry your cash games over the top. And wOBA stands a better chance at identifying these players than ISO. So while ISO wins this battle, I’m not certain that it has clearly won the war. However, I do think the data clearly shows that we should be placing more emphasis on ISO and the true answer to which metric should be considered the “King of Cash” likely lies somewhere in between the two. Building your models with both metrics represented will likely help to provide that increased ceiling we spoke about in the intro and the floor many of us covet.
My biggest takeaway from this exercise is to not be afraid to challenge the status quo. DFS as a whole is still young and we’re all learning and adapting constantly. Maybe ISO will never overtake wOBA as the go-to cash game metric, but working through this process has certainly opened me up to the possibility that even if it doesn’t, it’s likely closer than many of us may have believed.