
In our models, we have a column titled “paceD” that measures the difference between a team’s pace (defined as the number of possessions a team uses per game) and their opponent’s pace. This is a huge factor in NBA DFS because even though we are told minutes are “DFS gold,” actually possessions are. It’s great that Mike Conley gets 35 minutes in a game, but you also have to know that his 35 minutes might equal the same number of possessions as only 30 minutes for Ty Lawson, for example.
This is obviously a very important part of DFS research, but here’s the most important question: is it usable? That’s key because while we may know that possessions are perhaps the most important things in NBA DFS projections, if that factor is already perfectly priced into player salaries, it’s par-for-the-course. Or in more blunt terms, it doesn’t really matter to us.
Thankfully, our Plus/Minus metric is salary-adjusted, which means we can use the Trends tool to see how players on high-pace teams have performed in relation to their salary when playing against low-paced teams. To do this, I looked three particular variables from last year (and quick note, this is only for players above 10 minutes a game):
- How the entire league performed against the rest of the league, against top-five paced teams, and against bottom-five paced teams
- How top-five paced teams (Warriors, Rockets, Suns, Nuggets, Celtics) performed against the rest of the league, against top-five paced teams, and against bottom-five paced teams
- How bottom-five paced teams (Grizzlies, Pelicans, Knicks, Heat, Jazz) performed against the rest of the league, against top-five paced teams, and against bottom-five paced teams
Here were the results of the study — I think it actually shows us some really interesting things.
| League | Top 5 Pace | Bottom 5 Pace | |
| League vs | 0.52 | 0.74 | -0.16 |
| Top 5 Pace vs | 0.69 | 1.27 | -0.32 |
| Bottom 5 Pace vs | 0.43 | 0.28 | 0.24 |
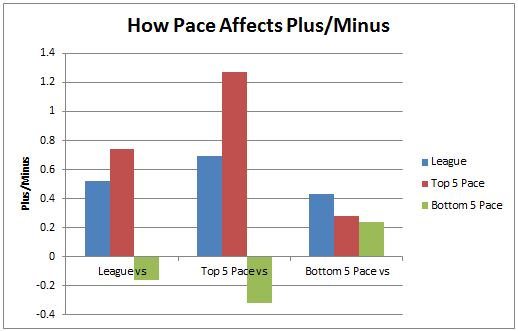
So to read this, the three bars on the far left are how the entire league performed against those specific situations. As you can see, the NBA as a whole has performed positively against each other, even more positively against top-five paced teams, but negative against bottom-five paced teams. The data here is really telling and I believe there are two main takeaways.
Top-paced teams are greatly affected by who they play.
When those top-paced teams listed above played, they were better than league-average, as you can see by the difference in the first two blue bars. However, they jump up significantly when playing each other – there’s an additive effect here. I’m not particularly sure why that is, but the data is pretty telling in that focusing on top-paced teams against top-paced teams has been a very beneficial move in NBA DFS.
Again, this shows that it isn’t priced into DraftKings salaries. Plus/Minus is already adjusted for salaries, so the bump in Plus/Minus doesn’t show the bump in fantasy production – that’s obvious – but rather it shows the bump in value. And as I’m sure you know – that’s what we’re concerned about in DFS.
Bottom-paced teams aren’t affected by any variable.
We saw the additive effect above for top-paced teams – and the opposite when they played slow-paced teams, as they dropped significantly – but we don’t see the same thing happen with bottom-paced teams. In fact, they’re positive in any situation. This tells us that no matter who they play, whether it’s your average team, your high-paced team, or even one of their fellow slow teams, their fantasy value stays the same.
That doesn’t mean they’re more valuable, though. I do think the knowledge of this is valuable, however, as we can answer the unstoppable-force-immovable-object-style question of “if a high-paced team goes against a low-paced team who wins? Do they meet in the middle?” Clearly, the data shows that in terms of fantasy value, they definitely don’t meet in the middle. Low-paced teams drag everything down except for themselves – they’re already on the floor and don’t get lower (as opposed to high-paced teams who get more valuable when they play each other).
So practical takeaways – first, don’t take players on low-paced teams when they play high-paced teams thinking that you’re going to get a boost in value. It’s not true; they stay the same. Second, don’t take high-paced teams going against bottom-paced teams. In those situations, they’re going to be dragged down by the lower-paced team and essentially be overpriced for that particular slate. You shouldn’t avoid completely – especially superstars in tournaments – but I wouldn’t focus on those players in cash games at all.
Definitely check out our models, especially since they’re free right now while we’re in BETA. That “paceD” column is something you should monitor every night. If you see a team with a highly negative paceD, that means they average many more possessions than their opponent. And as shown above, that’s a situation you want to avoid.