Ahh, the All-Star Break, the time when those of us who focus on NBA DFS attempt to master a new sport. Maybe we’ll take a shot at college basketball or give NHL a try.
Not this guy.
Instead of my usual donation to the sharks of the previous respective sports this time of year, I’ve decided to forgo my usual charitable activities. Instead, I’m going to use my extra time in a way that will be more productive and, if nothing else, save my bankroll from it’s usual depletion while the NBA is on hiatus. This year, I’m going to start my MLB research early. And for a procrastinator such as myself, this is no small feat.
I haven’t spent a ton of time digging into our Trends tool for MLB, so this seemed like the perfect time to start and walk our readers through some of the functionality of the tools while I’m at it. My goal with all of this? Attempt to flush out a few trends that the best players from last April had in common and see if any of these trends are predictive of how players as a whole perform early in the season.
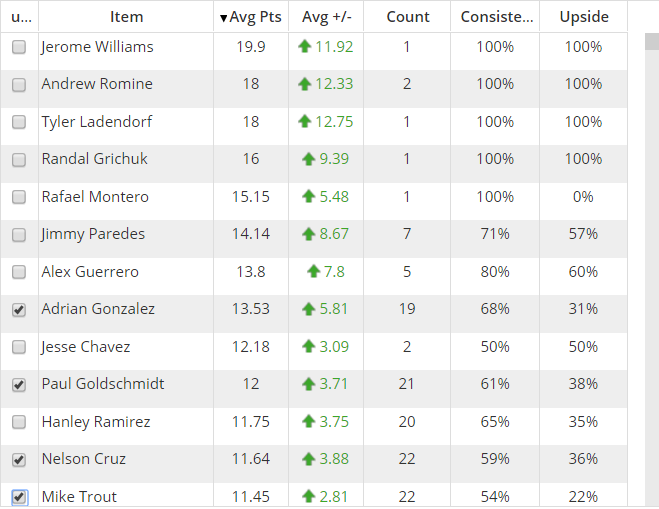
First, I’ll isolate the top-20 players from last April in terms of average DraftKings (DK) points per game, for players that appeared in at least 10 games.
Step 1: Time Filters > MLB Season > Select “2015”
Step 2: Time Filters > Game Month > Select “April”
And here’s our initial population and how they performed.

Step 3: Player Filters > Player Name > Sort by Avg Pts > Select Top 20 Players w/ at least a Count of 10


Step 4: Player Filters > Salary > Set to “4000 to 5500”

Let’s remove that filter and test out the next one.
Step 5: Weather Details > Temperature > Set to “50 to 92”

Step 6: Weather Details > Temperature > Set to “60 to 92”

Finally, let’s test out both filters on the population at the same time. Keeping the temperature filter in place, let’s add back in the price filter from earlier.
Step 7: Player Filters > Salary > Set to “4000 to 5500”

Conclusion
Let’s wrap up this extremely early exploration into MLB research with a few thoughts on the data we’ve uncovered.
The salary filters make a ton of sense to me. Earlier in the season in any sport, there will be a pricing correction that will occur after the first month or so. Playing a balanced lineup early on can often lead to a more stable group of players. Additionally, I don’t think many would be surprised to learn that players in colder games are apt to struggle a bit more.
If you find yourself struggling to fill the time over the next week, give the Trends tool a try and see if you can’t uncover some interesting trends of your own!