Our Blog


Mears: Building an Optimal Model for the 2019 PGA Championship

Brooks Koepka

Here at FantasyLabs, we have a Trends tool that allows you to query tons of situations and see how they’ve historically led to DFS value. For example, you can see how a golfer has done at specific events when coming in with awful recent form. Or without ever playing the course before.

Using all of that data — specifically the data points in our PGA Models — we can see which metrics have been the most valuable for the PGA Championship specifically and then use that data to optimize a model for this week.

To measure value, we use a propriety metric called Plus/Minus. It’s simple: We know based on history how many DraftKings points a golfer should score based on his salary, and then we can measure performance above or below that expectation.

A Note on Uncertainty

Before the data, though, let me briefly talk about the challenges of building a model this week and why that should color your analysis. I first did this piece last month for the 2019 Masters, for which we have a treasure trove of data. Augusta National has hosted the Masters every year since 1934. We have a pretty good idea of which golfers typically do well there.

The other three majors, though, all rotate courses each year. This year the 2019 PGA Championship is at Bethpage Black, which has hosted just four events ever: The 2002 and 2009 U.S. Opens and the 2012 and 2016 Barclays. Given that those were so far in the past and had different setups, I’m electing not to pay attention to that data when it comes to modeling.

There are three approaches you can take (and there isn’t a clear-cut right answer, in my opinion): Use old Bethpage data, use historical PGA Championship data or look at course comps (as Josh Perry mentions). Given that majors often set courses up similarly, I’m personally choosing to use historical PGA Championship data to backtest and build the model, but you can certainly use the Trends tool to take either of the other paths.

Anyway, let’s get to that data and the “optimal model”…

Building an Optimal Model for the 2019 PGA Championship

If we considered only the metrics that exceed the PGA Championship baselines by +6.0 Plus/Minus, here’s how the optimal model would look (total model points = 100):

  • Top 10 Odds Score: 10
  • Recent Birdie Average: 10
  • Recent Par-4 Scoring: 8
  • Recent Adjusted Round Score: 7
  • Recent Greens in Regulation: 7
  • Pro Trends Rating: 6
  • Recent Scrambling: 6
  • Recent Driving Distance: 6
  • Adjusted Round Differential: 6
  • Long-Term Adjusted Round Score: 6
  • Long-Term Scrambling: 5
  • Long-Term Par-4 Scoring: 5
  • Recent Field Score: 5
  • Long-Term Driving Distance: 5
  • Recent Par-5 Scoring: 4
  • Recent Eagle Average: 4

Here are the resulting player ratings for the top golfers in the model:

Brooks Koepka, winner of last year’s PGA Championship, leads this optimal model, which likely isn’t surprising considering that he’s the co-favorite to win along with Tiger Woods. Note, however, that none of the metrics in the model are based on course or PGA history. I’m looking at the data golfers had before tournaments and then how they performed. Brooks ranks first not because he won the tournament last year. He’s first because he has the best collection of data predictive of PGA Championship success entering the tournament.

The notable guys missing at the top are Justin Rose and Francesco Molinari, who rank poorly in the model primarily because of poor recent play: In recent greens in regulation, they have respective marks of 62.5% and 57.6%. Rose bounced back at the Wells Fargo with a third-place finish, but his Masters cut is dragging him down. Molinari, meanwhile, was last seen playing poorly at The Heritage, missing the cut and hitting only 50% of his greens.

But if you think those troubles shouldn’t be an issue here, both of those players seem to set up well at Bethpage. Being able to gain strokes on those second iron shots should be incredibly important, and both of these golfers are among the best in the world in that regard.

Overall, the data suggests that recent play is important entering the PGA Championship. We’ll see if that holds true this year after the schedule change (the tournament moved from August to May this year), but I would guess it would. The PGA Championship is supposed to be a test of a golfer’s all-around game. Players will need length off the tee but also precision with their irons, especially because Bethpage historically plays in the single digits.

As a result, this model favors players who are hot coming in and fading those who have been struggling: Six of the eight top metrics I weight have to do with recent form, not long-term form. And maybe it’s simply the case that golfers need to enter majors at their peak rather than try to find their way at these tough courses in strong fields.

Other players who are dinged due to uninspiring recent play include Paul Casey, Phil Mickelson and to an extent, guys like Bryson DeChambeau and Jordan Spieth. Guys like Brooks, Dustin Johnson, Rory McIlroy and Tiger all have incredible long-term metrics — plus they have the recent form to boot. Those are the guys I’ll be looking to buy this week based on this model.

Takeaways

Let’s go through some broad model takeaways now. First, there are obviously a ton of metrics to weight. You can certainly elect to keep things simpler, as there are certain metrics that really pop in terms of value. The biggest one is odds to place in the top 10, which is a new addition to our models and trends as of a month ago.

I was blown away by the backtesting numbers on that. It seems that top-10 odds — set by the betting market — is the most predictive metric for fantasy performance we have. It’s the highest weighted stat in my optimized model, and there’s certainly merit to giving it even more weight.

You’ll note that driving distance metrics, while important enough to make the model, aren’t the most weighted metrics. I think that’s fine given the metrics at the top: The market likely incorporates driving distance into top-10 odds, and guys who hit it longer will likely have superior birdie averages and scores on par 4s. Further, I think this course will test a golfer’s complete tee-to-green game rather than just his ability to bomb. Those second shots on par 4s will be critical, as shown by the inclusion of both long-term and recent par-4 scoring in the model.

One final note: It’s usually wise to rely on our Long-Term Adjusted Round Score metric, which is a catch-all data point that is the best proxy for a player’s talent. The lower the number, the better the golfer. It’s not weighted as the most important factor in the model because it is probably already priced into the DFS market, but if you’re using this model solely for betting, it might be wise to weight it more heavily than I have here.

Make sure to use our Trends tool and tinker around with our models to build the right one that works for you this week. The data points to all-around golfers in excellent form, but you may be able to find a different edge — especially for guaranteed prize pools.

Good luck!

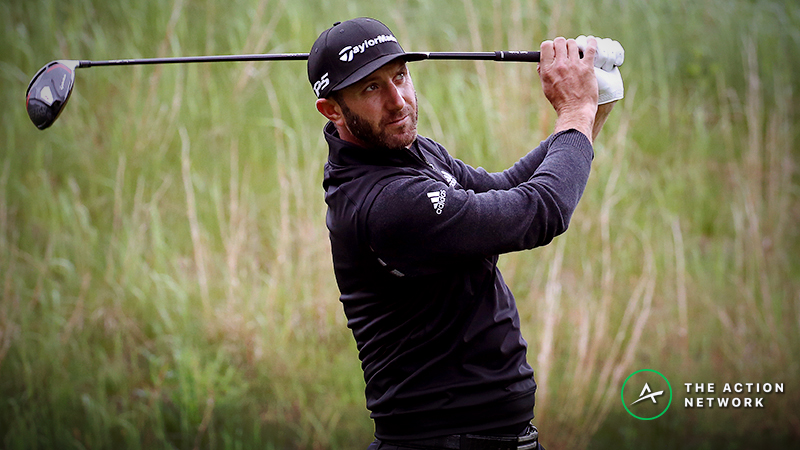
Pictured: Brooks Koepka
Photo credit: Ray Carlin-USA TODAY Sports