
Here at FantasyLabs, we have a Trends tool that allows you to query tons of situations and see how they’ve historically led to DFS value. For example, you can see how a golfer has done at Augusta when coming in with awful recent form. Or without ever playing the course before.
Using all of that data — specifically the data points in our golf models — we can see which metrics have been the most valuable for Augusta specifically and then use that data to optimize a model for this week.
To measure value, we use a propriety metric called Plus/Minus here at FantasyLabs. It’s simple: We know based on history how many DraftKings points a golfer should score based on his salary, and then we can measure performance above or below that expectation.

Building an Optimal Model for the 2019 Masters
If we counted just metrics that tested at a +2.0 Plus/Minus or higher above the baseline at Augusta, here’s how the optimal model would look (total model points = 100):
- Top-10 Odds: 18 points
- Course Greens in Regulation: 7
- Recent Par-4 Scoring: 6
- Long-Term Par-4 Scoring: 6
- Recent Birdies: 6
- Recent Greens in Regulation: 6
- Odds to Win: 5
- Long-Term Eagles: 4
- Recent Adjusted Round Score: 4
- Long-Term Birdies: 3
- Recent Bogeys: 3
- Course Missed Cut Rate: 3
- Long-Term Consistency: 3
- Course Adjusted Round Score: 3
- Putts Per Round Differential: 3
- Recent Scrambling: 3
- Recent Eagles: 3
- Long-Term Putts Per Round: 3
- Long-Term Greens in Regulation: 3
- Long-Term Driving Distance: 2
- Long-Term Adjusted Round Score: 2
- Long-Term Missed Cut Rate: 2
- Recent Driving Distance: 2
Here are the resulting player ratings for the top golfers in that model:

Some guys who stand out as the best value players are in that mid tier range: Hideki Matsuyama, Francesco Molinari, Tommy Fleetwood and Tony Finau seem to be especially underpriced. Other guys like Bubba Watson, Charles Howell III and Kevin Kisner are also intriguing mid-range options who rate highly in this model.
Interestingly, this model is a bit lower on guys like Paul Casey and Jordan Spieth, who notably have elite course history here at Augusta. My optimal model doesn’t weight course history as very important, but that could be for one important reason: Models are designed to rate the overall field.
That means that course history is less important than top-10 odds for the entire field of golfers, but that doesn’t mean there aren’t outliers for whom it matters greatly. That’s not a flaw of models, but it does reinforce that you shouldn’t just build and then blindly create lineups or make bets.
There’s a lot of context this week, especially with a guy like Spieth, who is in absolutely terrible form for a year now but always crushes Augusta.

Takeaways
Let’s go through some broad model takeaways now. First, that’s obviously a ton of metrics to weight. You certainly elect to keep things more simple, as there are certain metrics that really pop in terms of value. The biggest one is odds to place in the top 10, which is brand new in models and trends for this week.
I was blown away by the backtesting numbers on that. It seems top-10 odds — set by the betting market — is perhaps the most predictive metric for fantasy performance we have. It’s the highest weighted stat in the optimized model above, and there’s certainly merit to giving it even more weight.
In fact, the optimized model above tested really well with a +10.0 Plus/Minus (which is ridiculous), but a model that weights just top-10 odds and Long-Term Adjusted Round Score at a 75/25 ratio actually does better with a +11.3 Plus/Minus. Really, it comes down to some minor details.
For example, the model with just top-10 odds and LT Adj Rd Score actually has a higher R^2 (correlation):
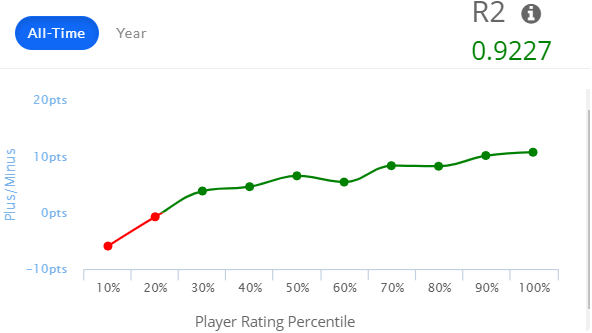
But the optimal model does a bit better in that mid-tier range despite a lower correlation overall:
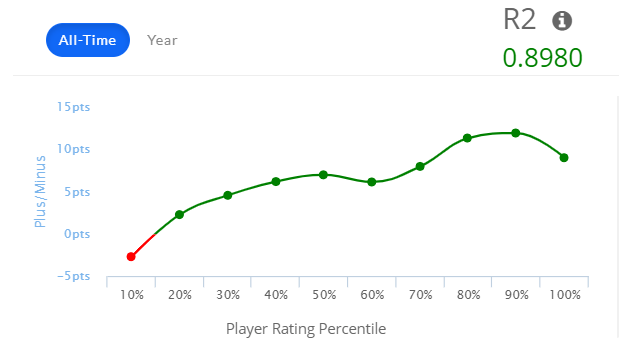
If you aren’t worried about difference in ratings between, say, Rory McIlroy and Dustin Johnson, then having that lower correlation is not an issue. In fact, having a higher Plus/Minus in the mid-tier might be better, as that could be a tier that’s harder to distinguish between.
Further, an optimal model with more weights will obviously pick up more course-specific angles. The model that just weights top-10 odds and LT Adj Rd Score doesn’t factor in Augusta at all, in fact. Or recent play. Maybe those things are overrated by the public, or maybe it’s a nuanced issue: Perhaps course fit matters more for the lower- and mid-tier golfers than it does for the upper echelon guys who have the talent to compete anywhere.
In my opinion, that’s the utility of the tools: You can use them however you want. Maybe you want to build a model that is good at finding value for longshots — those golfers that are likely to be incredibly low-owned and could be differentiators in the Milly Maker. Some models will be better for cash games, while others have more high risk-high reward golfers.
All in all, I would lean heavily on two important metrics: top-10 odds and LT Adjusted Round Score. Then you can tweak from there and start building lineups. Good luck this week!
Photo credit: Orlando Ramirez-USA TODAY Sports. Pictured: Hideki Matsuyama


