“Invent a statistic.”
This was the challenge issued to the FantasyLabs writing team earlier this week by our own Bryan Mears. On the surface, it’s a simple enough idea. Slap together a few metrics and voila, a new stat is born.
But the context behind Bryan’s request is what drove me to really delve into the idea of creating something new. To develop a meaningful statistic – i.e. not just slapping together a few metrics – we should be attempting to create something that is missing right now. We should be filling a need.
The thought process behind it is really no different than creating any product or service. Identify a need and figure out a way to meet it.
Immediately, I was drawn to the idea of finding a way to capture and quantify a pitcher’s performance on the field in relation to their fantasy performance. Furthermore, I wanted a way to factor regression into the metric, as best I could anyway.
What was born from this idea is a statistic that will hopefully help you not only track the true performance of a pitcher, but project future performance as well.
KBXE
As if you didn’t have enough acronyms to track in baseball already, I present to you KBXE. Let’s start by breaking down the metrics that make up the acronym before diving into the calculation itself. For a few of the metrics, I’ll defer to the wise and knowledgeable words of Bales, because well, why re-create the wheel?
K = K/9
In terms of baseball metrics, K/9 is really quite simplistic. To arrive at our result, we take a pitcher’s total strikeouts and divide it by their total innings pitched, then multiply it by nine.
Very simple, yet potentially the most powerful pitching metric we have, in terms of fantasy production at least.
Here’s what Bales had to say about it’s correlation with fantasy production –
The correlation between strikeouts and winning cash games is so strong that you could make an argument that the majority of your daily fantasy baseball research time should be allocated to predicting strikeouts for pitchers.
B = BB/9
Also incredibly simple, BB/9 is calculated by taking a pitcher’s total walks, dividing it by total innings pitched and dividing it by nine.
While not nearly as powerful a predictor of future success as strikeouts, walks – especially over more than a start or two – can be useful in projecting a pitcher’s future performance. If you routinely issue free passes, it’s certainly possible to find fantasy success, but doing so is a red-flag in terms of potential future negative regression.
Identifying a pitcher with an overly-high walk rate in comparison to both their fantasy production and ERA can be a sign that regression may be in their future.
X = xFIP
From FanGraphs:
Expected Fielding Independent Pitching (xFIP) is a regressed version of Fielding Independent Pitching (FIP).
Fielding Independent Pitching (FIP) measures what a player’s ERA would look like over a given period of time if the pitcher were to have experienced league average results on balls in play and league average timing.
And now broken down a bit from Bales –
The idea is that pitchers don’t have much control over what happens once a ball is hit, so FIP attempts to remove the “luck” and provide a number that’s more predictive of future ERA than past ERA.
xFIP adds another layer by also calculating how many home runs a pitcher should have allowed based on his fly ball rate—something that generally regresses toward the mean. So in effect, we’re trying to calculate what a pitcher’s ERA should look like based on how he’s pitched, attempting to account for the randomness of batted balls.
E = ERA
Even the casual baseball fan should be familiar with this one. Earned Run Average (ERA) is calculated similarly to K/9 or BB/9 — we take the total number of earned runs allowed, divided by the total number of innings pitched, and multiply it by nine.
ERA is not necessarily indicative of a player’s future performance, but it is reflective of his actual production at the moment, regardless of if it’s fluky or not.
The Formula
Okay, so now we know the pieces, let’s see how they fit together.
KBXE = K/9 – BB/9 – ((xFIP – ERA)/2)
What I’ve attempted to do with this formula is take concepts that we may consider independently when looking at how a pitcher is performing and combine them into one measurable metric.
Because K/9 is so positively correlated with fantasy success, it’s used as our base. From there, we’ll remove BB/9 – because a high walk-ratio increases the likelihood for future negative regression – and take the difference between xFIP and ERA, divided by two. What we’re doing here is attempting to smooth out the difference between how many runs a pitcher should be giving up and how many they are.
The higher the results of the formula, the better. We’re hoping to identify a few things with the statistic. The results should help in identifying potential underlying future issues for players; i.e. if a players has a ton of strikeouts and also a low ERA, but they’re walking a lot of people and getting lucky outs, their score will be far lower than a player that has a ton of strikeouts and a high ERA, but has just hit a streak of bad luck.
When looking at it’s correlation to fantasy production, KBXE had an R-value (the correlation coefficient, a measure of the strength of the relationship between two variables) of .92 (perfect correlation = 1.0), showing an incredibly strong correlation, likely due to strikeouts accounting for a heavy percentage of the formula. The sample population wasn’t huge, as the analysis was run on the top-50 fantasy pitchers from last year, but the logic behind the formula helps to strengthen my confidence in the metric as a whole.
For reference, let’s see what a top-20 list would have looked like last year (click to enlarge).
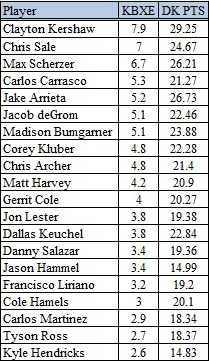
Some may be surprised to see a name like Jake Arrieta all the way down at fifth, but with an ERA of 1.77 and an xFIP of 2.61, there’s a sound case to be made that some amount of negative regression may occur in the future.
On the other hand, we have a player in Carlos Carrasco all the way up at the four-spot. His high ranking is due to a high K/9 rate of 10.58 and an xFIP of 2.66 as compared to an ERA of 3.63. Such numbers imply that he may be due for a bit of positive regression, if he just gets a bit more luck on his side in the future.
Looking at the full season totals has value, but what I’m really hoping to do with this statistic is be able to better forecast which pitchers are set for either positive or negative regression throughout the season. I’ll be calculating this statistic on an on-going basis, so be sure to check back throughout the season for updates on how players are rating out on the KBXE scale.
My hope is that as a supplement to our amazing tools, namely the Trends and Player Models tools, KBXE can help give you guys that little bit of an edge we’re always looking for. As the start of the season creeps up, be sure to play around with different Trends and get things set for the season, it’ll be here before you know it!