In basketball, minutes are king and if you want consistency in NBA DFS, follow the minutes. Even I am not stupid enough to challenge that one. But what about per-game counting stats? I wanted to run a few trends to see which provided the most added value in daily fantasy basketball.
To do this, I setup three trends containing the top 30 players among the league leaders in assists, rebounds, and free throw attempts. Free throw attempts might seem a little bit out there in comparison with the others, but my theory is that players who get to the line every night have a higher floor because of more opportunity to make easy buckets.
Let’s get right into the numbers:
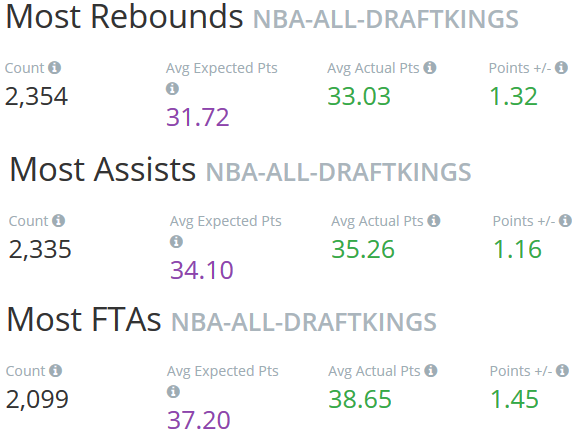
All three trends added value – well, there are a lot of good players included here, so that makes sense. You could buy a top rebounder at a cheaper price, and the leading free throw shooters (by volume) were the most expensive. Some of the cheaper rebounders included Omer Asik, Marcin Gortat, and Tristan Thompson. In terms of value added, the results are so close that I’m not sure I want to really jump to any conclusions at this point.
The home/away splits for each group were more or less even, but the Most FTAs group added the most value, averaging over 2 points more at home as opposed to on the road. I wanted to see if these players were getting more free throw attempts at home due to a little home cooking from the referees, but that’s not really what I saw.
Bosh and Wade had more attempts at home, but most of the guys I checked actually averaged more on the road. Most players did shoot a little bit better at home though. That, mixed with the simple fact that teams play better at home overall, probably accounts for the nice Plus/Minus number.
While top free throw shooters and rebounders did better as favorites, the top playmakers actually fared better as underdogs. That’s interesting and I don’t really have an explanation for it. The top result in the category was LeBron James, who put up a +7.9 Plus/Minus in 10 games as an underdog last year, followed by Reggie Jackson (+4.84) and Mo Williams (4.73).
It’s interesting that these three were among the league leaders in assists, but also possessed the capability to single-handedly take over a game on offense. I think there’s probably something to that, but would want to research it a bit more.
Somewhat unsurprisingly, the “Most FTA” group posted the highest numbers when Vegas projects the team to score 100+ points. It makes sense that the most aggressive scorers would fare the best when there are more points to go around. The numbers are even better when broken down by favorites and dogs. In a fast-paced game against a better team, these players are probably going to carry a higher burden to score.
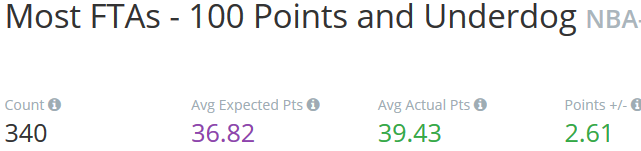
In closing, rebounds, assists, and free throws all actually produced consistently positive results. The “Most FTAs” group had the highest overall Plus/Minus and also the highest Plus/Minus within an individual category (100+ Points & Underdog), making it a great stat to keep in mind. I think it’s especially useful in cash games since, as I stated in the intro, consistent FT attempts should raise a player’s floor a bit.