(All data referenced below is collected from the $25 Massive Double Up on DraftKings)
If you’ve ever wondered how ownership percentage rates translate into earning cash, here’s a look at a 45,250 entry contest from DraftKings this past weekend. Let’s jump right into the data. The following table references each player with a minimum of 10% ownership in this particular cash game. I believe this is a good statistical sampling of usage for all cash games on DraftKings this past weekend.
Total ownership percentage is in the first column, with total number of uses (out of 45,250 entries) in the next column, followed by times this player cashed in a lineup and times he didn’t. The last two percentage columns state the percentage of lineups that cashed if that player was in the lineup. Here is the table:

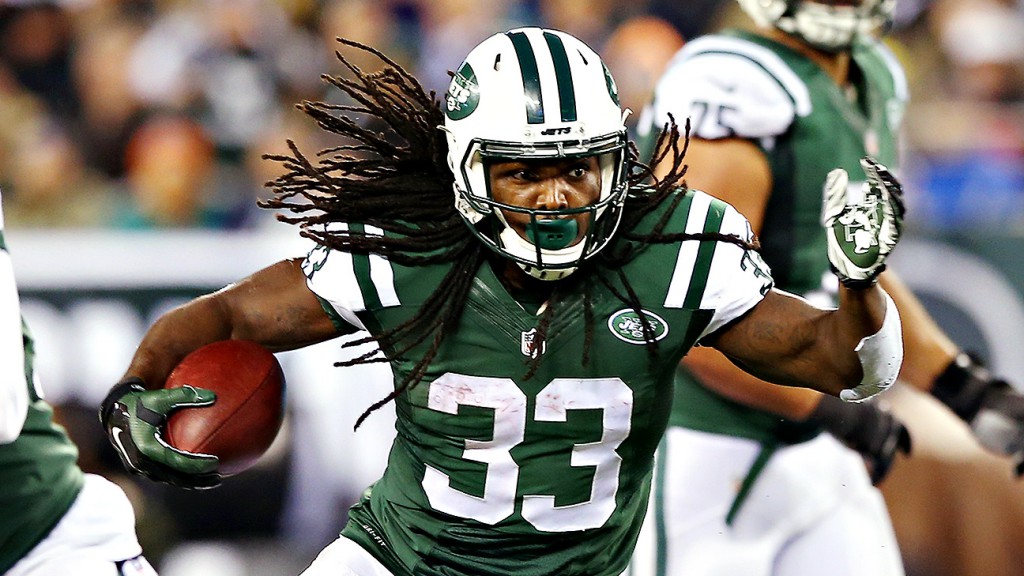
It’s clear to see that Chris Ivory and DeAndre Hopkins were rock solid this week, and you likely didn’t need this chart to already have guessed that. In fact, there were 3,717 lineups that combined those two players, and 3,607 (just over 97%) of those lineups cashed.
However, there were some glaringly big names at the bottom of the list that crippled many a cash game lineup, most notably three of the four most used Patriots, who many expected would put up a 60-burger on Indy. Nearly a quarter of the field (22.78%) chose to roster Rob Gronkowski, and less than a third of those cashed. Julian Edelman and Tom Brady didn’t help either, as only around 40% of the lineups using either of them cashed. And digging deeper into the numbers, there were 1,419 lineups that used all three of Brady, Gronk, and Edelman, and of those only 293, or 20.6% cashed.
Charcandrick West was a name that 17.1% of the entries took a gamble on without knowing the details of the Kansas City backfield and how they would utilize a West/Knile Davis split. The $4,000 price tag was attractive, but in the end, less than 30% of those lineups hit pay dirt.
When combining usage with percentage of lineups that cashed, the table below shows that the most crippling player this past weekend by far was Randall Cobb. This week marked Cobb’s third sub-10 point performance in a row, but still 3.5% of the field took a chance on him at home hoping his numbers would regress upwards. No dice. The following table lists the most crippling players in order, of those who were owned between 3-10%:

With a Vegas team total expected over 30, it’s very surprising to see five Packers on this list (not to mention Eddie Lacy near the bottom of the over 10% ownership list above). Given the evidence above on how the top Patriots foiled so many lineups and seeing here how the Packers did the same thing, it tells me that this was an incredibly tough week to predict. Who would have thought that stacking anyone on the top two projected totals would result in such poor performance?
Author Bio:
Greg Scharlach graduated from the University of Southern California in 1993 with a degree in Sports Information. After spending time with the Los Angeles Dodgers, Los Angeles Clippers, and Rancho Cucamonga Quakes in the Public Relations departments, he changed careers and became a Financial Advisor in 1995, but never lost the passion for sports. He has been playing in numerous season-long Fantasy Leagues since 1994 (both MLB and NFL), and has been studying the Daily landscape for several years. You can follow him on Twitter @USC_Dragon.
