
When I wrote my first piece for FantasyLabs and called it “Strokes Gained Is Overrated,” I had a feeling I’d get some pushback from the DFS community. Strokes gained has been a mainstay in write-ups and projection systems since the start of PGA DFS, so it wasn’t too surprising that people would want to defend it. My case against strokes gained (and in favor of conventional data) can be summarized in three points:
- The difference between strokes gained and properly adjusted conventional data is small.
- That small difference is not very important for predicting future outcomes.
- Strokes gained does not include non-PGA Tour results, which are more important than people realize.
The very fair criticism I received about the piece was that it was light on supporting data and evidence. So for my next three articles, I’ll explore each of the bullet points above with a detailed, data-driven explanation of their reasoning. We’ll start by showing that strokes gained and conventional data are not as different as you might think.
First, a hypothetical: If all information from strokes gained/ShotLink data could be derived entirely from conventional statistics, you’d agree that there’s functionally no difference between using conventional data and strokes gained, correct? Okay, well what if you could get 99 percent of the information? 90 percent? Or 75 percent? What’s your threshold for when the gap between strokes gained and conventional data is small enough where you wouldn’t think twice substituting one for another? Pick your threshold, and pick your number for what you think the gap actually is between strokes gained and conventional data. We’ll get to that number in a second.
As an example, let’s look at a single tournament: the 2015 Quicken Loans National.
In addition to conventional player statistics (total strokes, driving distance, driving accuracy, greens in regulation, putts per round), we have three strokes gained statistics for each player: total, tee-to-green, and putting. We’ll attempt to describe each of the three strokes gained statistics as a function of conventional data, and see how well those synthetically-derived estimates of strokes gained stats compare to the real ones.
First, the conventional data needs to be adjusted. For each player, we can calculate strokes per hole, which is just total number of strokes divided by the number of holes played. We also need to divide each player’s strokes gained statistics by their total number of holes, since strokes gained is an aggregate number and not a per-hole number. Next, we need to adjust each player’s statistics by subtracting out the tournament averages for each of those numbers, so we can see how each player did in each of their categories relative to the field. That gets us values like strokes-per-hole over average, driving distance over average, etc., which are similar to the intent of strokes gained. To illustrate, here’s a plot of adjusted strokes per hole versus total strokes gained per hole for this tournament:
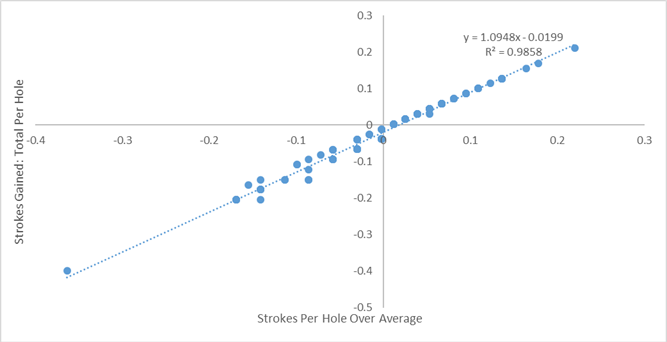
This is 100% expected, since the definition of strokes gained is “how many strokes you did better than the field,” so adjusted strokes gained in total should correlate strongly with adjusted strokes per hole.
However, almost no one uses SG:T and instead opt to use SG:T2G as a proxy for “overall” skill, mostly on the basis that putting involves more luck and is not as predictive of future results (a view I agree with). Here’s how adjusted strokes per hole compares to adjusted SG:T2G…
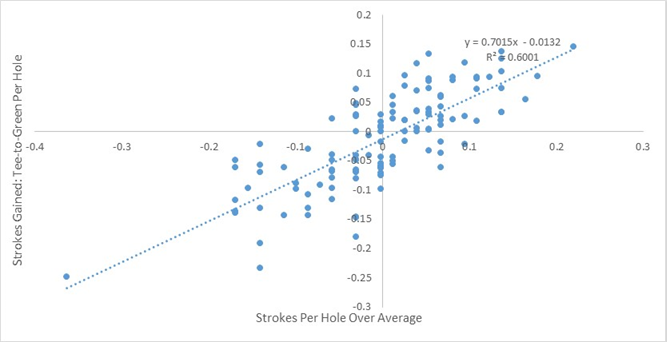
Adjusted strokes per hole accounts for 60% of the variance in SG:T2G alone. Not bad, but still probably below the threshold you specified above. However, we can improve on that. I ran a linear regression to try to predict SG:T2G as a function of adjusted strokes per hole, DD, DA, GIR, and PPR. The best-fit formula is as follows:
SG:T2G=-.013+(Adj. Strokes Per Hole)*.863+(Adj. DD)*4.78e-4+(Adj. GIR)*-.05+(Adj. PPR)*.0276+(Adj. DA)*.02
And here’s what predicted SG:T2G vs. actual SG:T2G looks like:
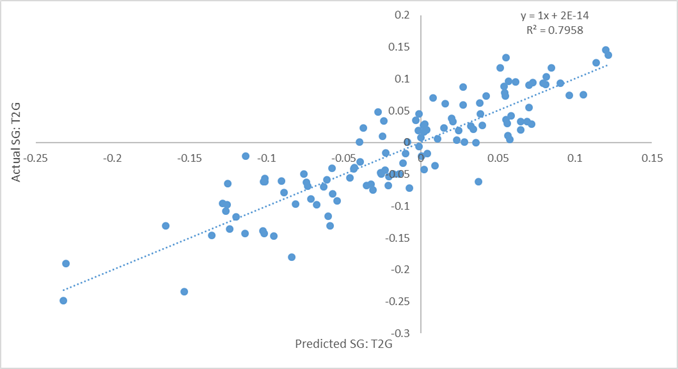
The r-squared of 0.8 means 80% of the information/variance in SG:T2G can be explained by conventional data. I don’t know what threshold you specified above, but to me 80% is significant. It’s probably a higher number than you thought it would be above.
Using the same methodology, here’s the regression formula and plot for SG:P:
SG:P=-.013+(Adj. Strokes Per Hole)*.24+(Adj. DD)*4.34e-4+(Adj. GIR)*.06+(Adj. PPR)*-.0266+(Adj. DA)*-.046
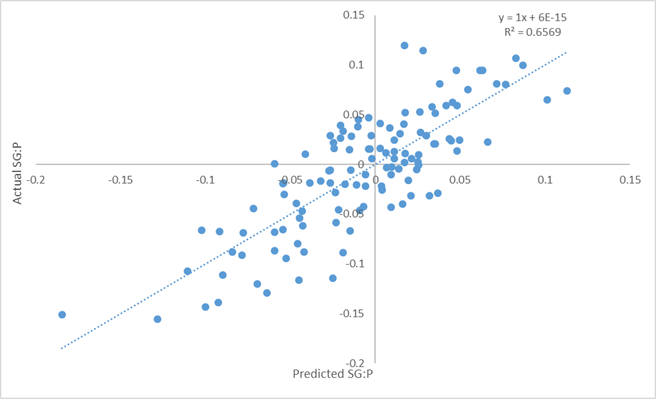
66% is definitely lower, and that’s expected: Putting involves far more randomness, and it correlates less with T2G-type statistics like DA and GIR. But it’s still at odds with people’s perception of SG:P as this super-precise measurement of players’ putting skills that’s impossible to determine without ShotLink data. Conventional data is still doing a pretty good job of explaining putting ability.
To be clear: for a single tournament, conventional data will never be outright better than ShotLink data if both are available. ShotLink is still more granular and can offer more specific information, but the net effect of its granularity and specificity gets overstated all the time.
Most of the value from strokes gained comes from the fact that it’s adjusting ShotLink data to show how each player does relative to the field, and the majority of that value can be captured by adjusting conventional data. That being said, 20% of the information in SG:T2G isn’t captured by conventional stats, leaving just enough wiggle room to wonder how important the missing information is in terms of predicting DFS outcomes. Next week, we’ll show exactly how important it is. (Spoiler alert: not very.)


