Can knowing too much about daily fantasy strategies be a bad thing? In some cases, yes. We’ve seen correlation charts, historical value studies and the like, and they’re all useful and great tools. But sometimes, they prevent us from pairing two players who perform well together. I’m going to specifically focus on RB-WR correlation in this article. As you may know, RotoViz’s correlation chart has this down as a -0.07 correlation.
Just at face value before moving on, how significant even is that? The most negative correlation on the board is -0.46, which is the correlation resulting from pairing a QB with the opposing D/ST. That makes total sense – one is literally taking fantasy points from the other in that case. The -0.07 correlation between RB-WR is a fraction of that and warrants further investigation.
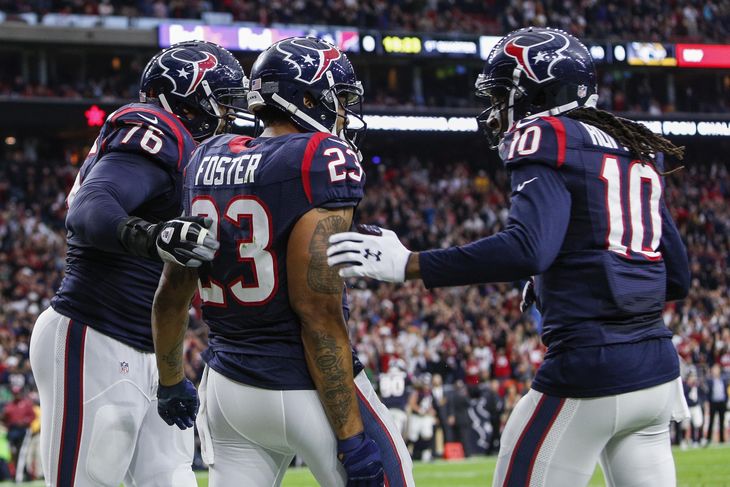
This is nothing more than a number inside a table – there is no distinction between RBs like Woodhead and Dion Lewis from Alfred Morris and Marshawn Lynch. I definitely agree that some, maybe even most, of the time, pairing RB and WR teammates is not a good idea. But there are exceptions. You don’t have to go back any further than this past weekend where Arian Foster and DeAndre Hopkins proved that.
So how do we differentiate? I think this is where market share comes into play. The market share rating charts what percentage of a team’s total targets or carries a player has commanded. The numbers I’m going to be using from this have come from Daily Roto and are a couple of weeks old. That’s okay because the correlations are more important than the names themselves.
The idea is that if you can corner an overwhelming majority of team production by rostering two players, does it really matter what position they each play? DeAndre Hopkins is being targeted at an absurd rate and Arian Foster has always been a bell-cow lead back. These two players represent a VERY large portion of the Texans overall offense.
Looking at the Falcons, 40% of the overall targets had went in Julio Jones’ direction while Devonta Freeman accounted for 62% of the carries. Julio has struggled a little bit lately, but I’m going to chalk that more up to health and a game on TNF than anything else. Julio scored 43.4 DraftKings points during the first week of Freeman’s breakout. In this game against Dallas, you had two players who exceeded 43 points, were both somewhat obvious plays (depending on your opinion of Freeman in his second week as a starter), and the stack was ignored by many due to the negative correlation.
Jones-Freeman is probably the best example moving forward, but here are a few additional examples where you could have cornered a large chunk of a team’s overall production by pairing an RB with a WR:
| WR | RB | Targets % | Carries % |
| Julian Edelman | Dion Lewis | 46.19% | 46.2% |
| Jamaal Charles | Jeremy Maclin | 47.79% | 62.3% |
| Brandon Marshall | Chris Ivory | 30.17% | 35.84% |
The names will change as the season goes on – as I mentioned, Hopkins and Foster is a great example and Le’Veon Bell and Antonio Brown is another one with potential once Roethlisberger comes back.
The other thing here is red zone opportunities. Touchdowns are obviously vital in NFL DFS and if you can pair the most likely red zone passing target with the most likely red zone back for a team, I think that’s another way to get around the negative RB-WR correlation.
Looking at the Vikings’ numbers, Adrian Peterson was the recipient of 61.29% of red zone opportunities, while Kyle Rudolph was targeted in 12.9% of red zone opportunities. By pairing these two, you could have given yourself a 74% chance that if Minnesota scored, your DFS team was reaping the benefits. It’s hard to imagine a game where the Vikings score multiple times and at least one of the touchdowns didn’t go to AP or Rudolph. Another good example is stacking Chris Ivory and Brandon Marshall from the Jets – with these two, you’ve rostered just a shade under 50% of all Jets red zone opportunities.
As with anything, don’t go overboard with this stuff. These combos are the exceptions, not the rule. There are a lot of teams who spread the ball around more and it’s difficult to corner the scoring market on those kinds of teams. For example, the best you can do with the Dolphins is stack Lamar Miller with Jordan Cameron – and that still only gives you about 26.5% of Miami’s red zone chances.
The -0.07 correlation between RBs and WRs is not ideal, but really it’s only a shade below being a completely neutral value. I don’t think the best way to utilize that knowledge is to avoid stacking these positions at all costs, but rather taking a closer look at the individual players and how they are used.


