Judging Vegas: Looking Back at the 2014 NFL Season

If you read any DFS articles, one of the biggest things you’ll hear repeated over and over again is to utilize Vegas. Although you may have a full-time job that prevents you from putting in 20 hours of research for each NFL slate, Vegas has that and more. Why not use the professionals’ information for your benefit, especially if it’ll save you some time?

Not only that, but Vegas has many incentives to be as accurate as possible. But as great and useful as they might be, they aren’t perfect. Sometimes, Vegas gets it wrong – they’re just banking on getting it wrong less than everyone else – and years and years of money show they’re good at that bet. So for our sake, since we’re using their data as a foundation of our research, it’s good to know when Vegas is right and wrong.

A quick note: “wrong” is a tough term here — even though we can see the lines that were off in hindsight, that doesn’t mean they were wrong lines. We know that sports are random and especially in the NFL where a season is only 16 games, the data is very susceptible to that randomness.

Anyway, thanks to our Trends tool, we can look at last year’s data to judge. To do this, I pulled the average spread for each team and compared it to each team’s point differential. Obviously, if Vegas were perfect, the team’s point differential and spread would be exactly the same – as you’ll see, that’s not the case. In fact, there are a couple teams where the difference is pretty large.

vegas 1

I’ve sorted the table by Spread/Point Difference, which just shows the difference between how the team actually performed in terms of Point Differential versus how Vegas projected them to perform in terms of the posted spread. For example, the Chiefs had a +4.5 per-game point differential on the year, but they had an average spread of +3.28, meaning Vegas underrated them. I know it’s a little confusing because a positive spread means the team is the underdog, but I hope it makes sense now.

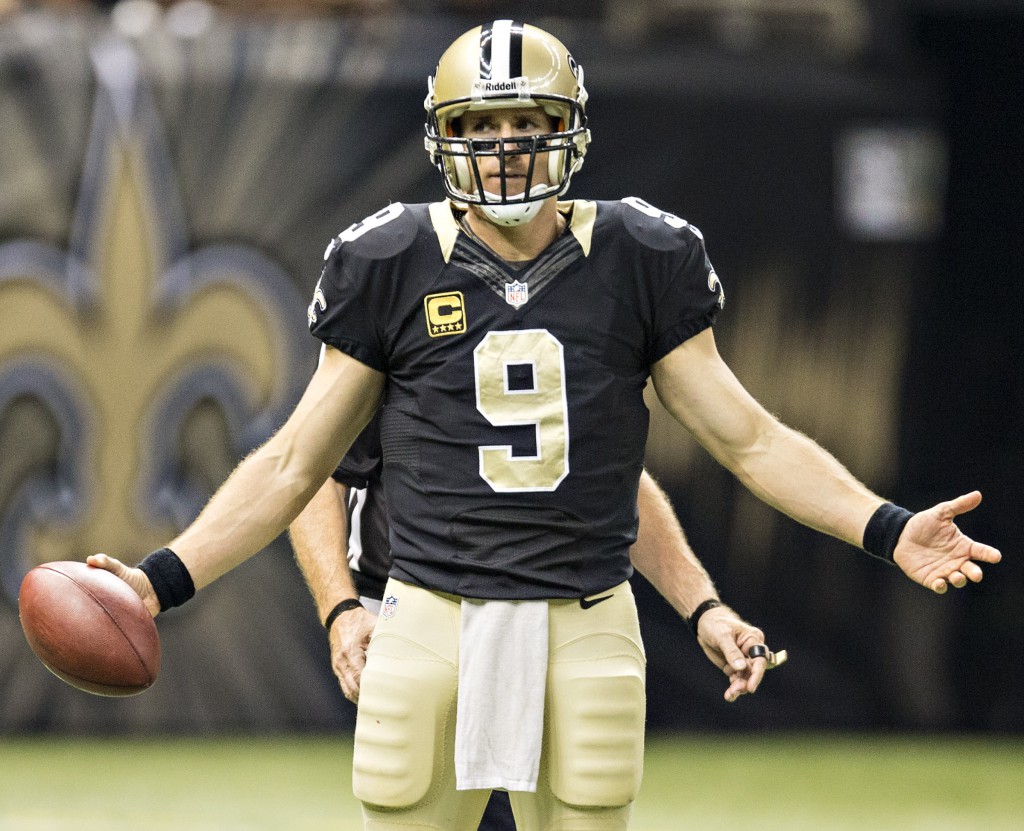
Interestingly, the Saints made the bottom of the list and by a pretty wide margin, as well. If you can remember, they were a trendy darkhorse to win the Super Bowl at the beginning of the year. However, they never really got it going, ending the year with a disappointing 7-9 record, despite being the favorite in 14 of their games. Personally, I kept waiting for them to turn the season around, and it seemed like Vegas was in the same camp.

Perhaps that’s why the Patriots are so high on the list as well. There was a time last year that the public was questioning whether Tom Brady was done; obviously that was a silly question. However, maybe Vegas was slow to catch up. The Patriots fell 2-2 out of the gate (when we questioned Brady) and then the Pats were dogs in the next two games against the Bengals and Bills. In fact, they were dogs in five of their last 11 games, despite only losing two of them as the season unfolded.

So how can this be used for DFS purposes? Well, I’m definitely not saying to not use Vegas spreads, over/unders, and props in your research; again, they’re as good as it gets. However, they’re not immune to being slow to catch up on a team. If you feel strongly that a team will bounce back — like the Pats last year — you’ll definitely find value there. Most likely, if Vegas is off a team, the vast majority of the public will be also.

I’ve always thought that the key to being successful in DFS is to understand your limitations. No one is perfect, no model is perfect, not even Vegas is perfect. If you understand the volatility of sports and DFS and learn when to embrace it, you could be in for a successful NFL season this year.