This is a weekly series that follows MLB trends created with our Trends tool. Although the trends in this series are made with specific slates in mind, they are designed to remain relevant throughout the season.
7/23: Opponent Distance
Given the emphasis we place on our Statcast data, chiefly batted ball distance, one stat I think sometimes gets overlooked is opponent batted ball distance. This filter, from a pitcher’s perspective, averages the batted ball distance of the opposing lineup. We are generally cognizant of an opposition’s weighted on-base average and power potential. But, just as we use Statcast data as extensions of these advanced metrics from an offensive perspective, we can at least consider it from the opposite perspective as well.
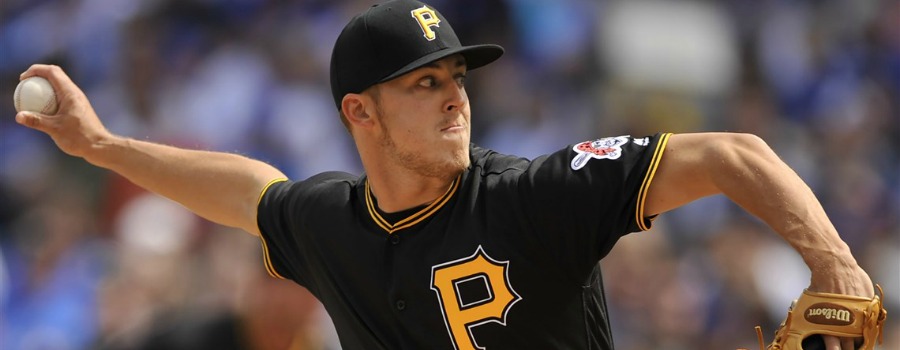
This stat is probably going to be more useful in certain situations than others. I’m pretty sure the Kansas City Royals have been rolling out some combination of the same 11 or 12 hitters since the 1980s, so maybe their average batted ball distance over the fantasy year isn’t going to be as useful. For the most part, we know who these players are. But looking at a team like the Oakland Athletics on 7/23, five of their eight batters had appeared in fewer than 100 games over the past 162. Their advanced stats, gathered over a smaller-than-average sample, will, at the very least, be extended by including the Statcast data. As it so happened, the pitcher facing Oakland was projected to be popular: Rafael Montero checked in at projected ownership of 17-20 percent — second-most on the main slate — behind only Clayton Kershaw. Although Oakland’s .282 collective wOBA was rather low, their collective 218-foot batted ball distance told another story.
(Pro Subscribers can view ownership projections each day within MLB Models.)
Looking at a cohort of pitchers projected to be owned in more than 15 percent of the field, the collective Plus/Minus is +2.47 on 29.8 percent ownership. When those same pitchers face teams whose collective batted ball distance exceeds 210 feet, that Plus/Minus drops to +1.21 while ownership remains high at 30 percent and 53.6 percent Consistency. The Plus/Minus is still good, but anytime I find a group of pitchers who will be owned by 30 percent of the field while falling short of their implied point total around half the time, I’m going to be interested in a fade.
Results
Montero had average ownership of 39.86 percent across the four DraftKings contests we track per our Ownership Dashboard, including 50 percent ownership in the high-stakes Thunderdome. He was not horrible, but his 12.95-point performance was not especially helpful either.
7/24: More Bad Bargains
I have previously written that a player with a poor Bargain Rating, who otherwise has a great matchup, will likely be owned on fewer rosters than he should be. Today, let’s get even more specific.
Bargain Rating, of course, compares a player’s cost relative to the salary cap on DraftKings to his relative cost on FanDuel, and vice versa. A high Bargain Rating indicates the player is relatively cheap on the site you are looking at, while a low one indicates he is relatively expensive. While not all DFS players will be familiar with Bargain Rating specifically, they’re likely to have a general idea of a player’s value, and they should have the ability to spot a player whose price sticks out.
Now, for some specifics. Let’s use two trend filters to very generally define what a positive matchup looks like:
• The closing moneyline is between -175 and -150
• The player’s strikeout prediction is between 8-10
Applying these filters leads to these results:

As expected, these players perform well but are extremely chalky. Now, let’s introduce a Bargain Rating filter. When a player’s Bargain Rating is between zero and five, the Plus/Minus drops a little bit to +2.00 and average ownership sharply declines all the way down to 12.7 percent. We haven’t said anything different in regard to the pitcher’s matchup; all we’ve done is narrow the cohort down to include only players who are overpriced on DraftKings relative to FanDuel. Will you trade a +2.50 Plus/Minus on 28.9 percent average ownership for a +2.00 Plus/Minus on 12.7 percent average ownership? These are the kinds of decisions you should be thinking about as you construct your teams for large guaranteed prize pools. The introduction of one ‘negative’ filter to an otherwise positive trend can help find contrarian options.
Results
Brad Peacock, the trend’s match on 7/24, underachieved, scoring 10.35 fantasy points in a matchup against the Phillies. But consider this: the same pitcher who was reaching massive ownership levels at 24.8 percent and 28.6 percent only a few starts ago was 8.7 percent owned on Monday as a large favorite in a game he was predicted to exceed eight strikeouts. You have to shoot your shots.
7/25: The Umps in San Fran
What happens when there is an umpire who favors batters in a game held at AT&T Park, the most favorable park for pitching in the league? On the 25th, Jameson Taillon and Madison Bumgarner were scheduled to meet at AT&T Park in a pitcher’s duel with an over/under of 7.5 runs. The one curveball was home plate umpire Jerry Meals, who has not been kind to pitchers historically. In fact, of all the umpires in our database, only one umpire has hit pitchers with a more negative cumulative Plus/Minus than Meals. On average, pitchers in Meals’ games are hit with a -1.80 Plus/Minus; overall, Meals has siphoned -380 fantasy points (DraftKings) from pitchers who dare to toe the mound before him.
Getting back to AT&T Park, I created a trend that included games where one of the worst umps for pitchers has been behind the plate in San Francisco. In 37 of these games, pitchers have scored a -2.59 Plus/Minus, indicating the ump has mattered more than the park in these games.
Results
Taillon’s high price tag – he was actually the most-expensive player on this slate – limited his average ownership to 4.28 percent, per our MLB Ownership Dashboard. That’s a good thing, because he scored -15.85 points. You read that right: 15.85 points below zero. Bumgarner, on the other hand, was popular at 28.26 percent ownership. While he avoided disaster, his Plus/Minus score of +0.01 is probably not one that his mother would hang on the fridge.
——
Thanks for following along with my three custom trends this week. As always, there’s plenty more left to be explored via the Labs Tools.


