Although it wasn’t possible to track a new trend this week due to the NBA All-Star Break, I do want to take this opportunity to reflect on a few things I have learned over the past couple of months while writing the series and also while using FantasyLabs in general. In this article, I will address a couple common mistakes I think people make and hopefully provide some insight to our users who haven’t leveraged the Trends tool to its full potential.
Sample Size
One of the most frequently asked questions about the Trends tool that I receive from our users is, “How large of a sample size should I use?” I think the answer to this question is the always annoying, “It depends.” And while I don’t have a firm threshold that I use when creating my own Trends, I do certainly follow a few rules of thumb.
The most important question I ask myself is, “Do the results reflect the circumstances?” To illustrate what I mean, let’s look at the CJ McCollum. CJ has an awesome +6.34 Plus/Minus on the road this season, and a +1.96 score at home, which is also really solid.

The problem is you can’t buy McCollum today for the same price you could when he played many of the games in the result set. CJ was about 10% cheaper than his current price back in November, when many of these games occurred, which allowed him to rack up several games near +10 in Plus/Minus during that time. If McCollum had played every game at his current price range in the mid-to-low $7000 range, his Plus/Minus would be vastly different.
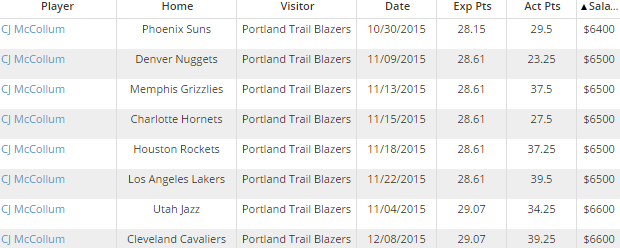
So let’s try to adjust this Trend. Since it’s unlikely we’re going to be able to buy CJ at a price below the $7000 range going forward, let’s filter to include only games where he has cost $7000 or more. His overall Plus/Minus goes way down:

Surprisingly, his Away split gets even better. However, while he had a relatively strong +1.96 in Home games previously, his -0.63 Plus/Minus in Home games when he costs $7000 or more now looks pretty bad.

Sure, we only have 21 games that match…but doesn’t it make sense to look at the 21 games he’s played at a salary close to his current price tag rather than the 52 games overall he has played on the season, including one game where he was priced as low as $4800?
Another obvious example that sticks out is the Phoenix Suns. Their active roster is so different today than it was in late October that I’m not sure you can really use any type of season-long data of theirs and expect an accurate representation.
We are conditioned to think, “Smaller sample = bad,” but it’s pretty easy to come up with examples where the smaller sample is the better one to use. On the other hand, if I were to setup a general, non-team or player specific Trend, I would always aim for a larger sample. With general Trends, current active rosters are less important.
Logic
“Logic” is probably a really bad heading, but I do think that sometimes, logic is overlooked as people try to come up with a magic formula when creating a Trend. If you’re willing to invest your hard-earned money in daily fantasy basketball, you probably have a pretty good understanding of how basketball works. While a good understanding of the game is certainly not the only thing you will need to be a successful DFS player, it is useful nonetheless.
As someone who follows the game and plays NBA DFS, does it make any sense to you that these filters would correlate?

When combining these filters, the Trend’s overall Plus/Minus is +2.86. Still, logically, it doesn’t really make sense that these filters, when used together, would be predictive of future results. When I am creating Trends for my Trend Testing Series, I try to use the fewest number of filters as possible and I only combine filters if it first logically makes sense to do so.
Type of Trend
Some players are more suited for GPP or cash games, some of our models are designed for GPP or cash, and you can design a Trend to be more useful in GPP or cash games as well. We recently added a Consistency Rating to the Trends page, and that score in combination with the overall Plus/Minus, is what I would recommend using here.
Here’s an example of a Trend that I would say is better suited for GPPs: players whose salary has dropped $500 or more over the last month. The Plus/Minus is pretty decent over a few thousand results and the Consistency Rating is 53.1% – let’s keep that in mind.

Next, let’s look at players whose Projected Usage is 25-30% and Projected Minutes is 20-plus. The overall Plus/Minus is lower and the Consistency is a bit higher over a decent sample.
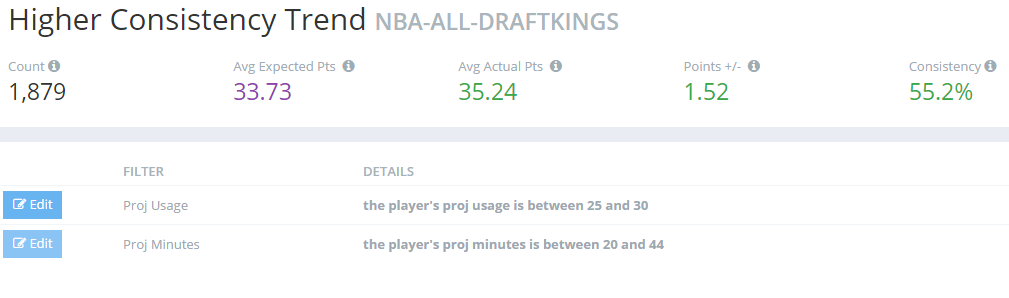
Think about the types of players that would qualify for the first Trend – if a player’s cost is down, they are probably running cold, playing through an injury, or recently had their role reduced. Since the price is down, a player who is able to break out of their slump has the potential to post a large Plus/Minus number. However, the price is down for a reason, making these players riskier at the same time.
On the other hand, a player whose usage and minutes are close to guaranteed is less likely to bust. But their steady role has been accounted for already by site pricing, which could make a huge Plus/Minus score a little tougher to achieve.
The Trend Testing Series I write has allowed me to not only gain insight on specific Trends, but also the tool itself. If you’ve followed the series this season, you’ve built up a decent library of custom trends. However, I would always encourage you to get in there and play with the filters for yourself – that is truly the best way to learn.