Bullpens used to be collections of arms headlined by hard-throwing closers. Ideally, they pitched no more than two innings per game. Nowadays ‘stoppers’ like Andrew Miller tend to enter games quite early. Per CBSSports, pitchers averaged just 5.6 innings per start in 2016 — the lowest mark since 2000.
With bullpens utilized more than ever, does it matter how ‘overworked’ a hitter’s opposing bullpen is? Let’s find out.
Opposing Bullpen Strength
Using our Trends tool, we can measure the percentile rank of how overworked a hitter’s opposing bullpen has been over the past three games. A higher number is better for hitters:
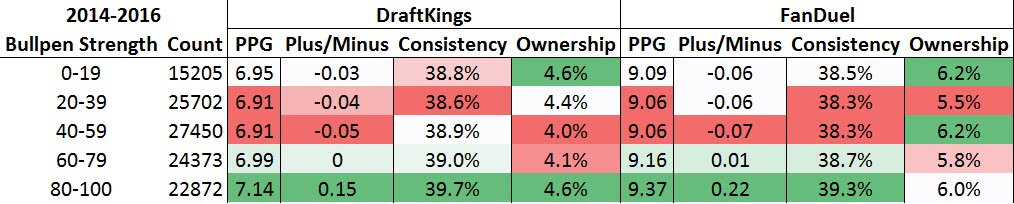
Targeting overworked bullpens has historically led to value over the past three seasons. With an opponent bullpen strength under 60, hitters have posted negative Plus/Minus values, but any mark over 60 has correlated with elevated points per game, Plus/Minus values, and Consistency Ratings.
Ownership has jumped all over the place on both DraftKings and FanDuel. While ownership tends to be higher in games with an opposing bullpen strength over 79, the overall ownership differential has been just 0.6 and 0.7 percentage points on DraftKings and FanDuel. The public generally hasn’t factored an opponent’s bullpen strength into lineup decisions.
Overworked Opposing Bullpens by Year
We’ve established that rostering hitters facing the most overworked bullpens has historically led to value. Let’s see whether this trend has been consistent over the past three seasons:

This trend has become stronger over the years. Overworked bullpens surrendered the most points per game and highest Plus/Minus values in 2016. Given that bullpens were used at an all-time high rate in last season, the 2016 performance of batters against overworked bullpens isn’t surprising.
Worst Bullpens Since 2012
Are certain bullpens particularly brutal when overworked? Since 2012, only 25 teams have posted a bullpen WHIP of 1.4 or higher. The Rockies (five), Phillies (three) and White Sox (three) are the only teams to have at least three such seasons. The Phillies and White Sox have allowed positive Plus/Minus values when their bullpens have been overworked, but the Rockies have been particularly bad.
Hitters vs. Rockies with Opposing Bullpen Strength 80-100

Those numbers are dirty, and amazingly the Rockies bullpen has been about as vulnerable on the road as at Coors Field:

Why is this the case? Perhaps it’s because what happens at Coors can carry over to the road. If the Rockies play a three-game series at home, where the bullpen is used heavily, the impact of that use will likely be evident in the games that follow, even if they are on the road.
What’s notable is that hitters have posted a whopping -5.9 percentage point ownership differential away from Coors Field. When batters are at home and facing a tired Rockies bullpen, they offer a significant edge.
Overworked Bullpens
In general, rostering hitters facing overworked bullpens has led to value on both DraftKings and FanDuel. Here are some specifics:
- Rostering hitters with opposing bullpen strengths over 60 has historically led to value. The most value has come from hitters on teams with opposing bullpen strengths between 80 and 100.
- Bullpens were especially overworked in 2016, when hitters set three-year highs in points per game, Plus/Minus, and Consistency Rating against tired relievers.
- The Rockies bullpen has been particularly abysmal, yielding a ton of value at home and especially on the road when overworked.
Within our Player Models we provide a percentile rank for each hitter’s opposing bullpen strength. When you’re constructing rosters with our Lineup Builder, consider hitters facing particularly overworked bullpens.
And, of course, be sure to do your own bullpen research with the FantasyLabs Tools.


