Player stats are a vital part of golf analysis, since they’re able to tell us which parts of a player’s game (driving, approach, putting, etc.) they’re strong or weak in, which matters for analyses like course fit and sustainability. One shortcut a lot of people make, however, is talking about these conventional stats as though they’re independent from one another, when they’re clearly not.
To illustrate, imagine two golfers of virtually identical skill, except one drives the ball 30 yards longer than the other. The longer driver over the long run will have slightly easier approach shots with a longer drive, opening up more opportunities to use shorter, more accurate irons, which will in turn boost his GIR, too. In addition, easier approach shots should lead to more birdie opportunities, since shorter irons make for easier shots closer to the pin, reducing his putts per round.
If you look at these two golfer’s stats, the longer driver will have better raw numbers in driving distance, GIR, and putts per round, but the only actual difference between the two golfers is that one drives longer than the other. This illustrates one of the limitations of conventional stats: They’re inevitably connected to one another, distorting the “true” isolated components of each player’s skill sets.
How connected are they? See for yourself. I took each player’s average adjusted stats (driving distance/accuracy, GIR, scrambling, and putts per round) going into each tournament for 2016 and created a scatter matrix to illustrate how each stat correlates with each other stat. Here’s what that matrix looks like:
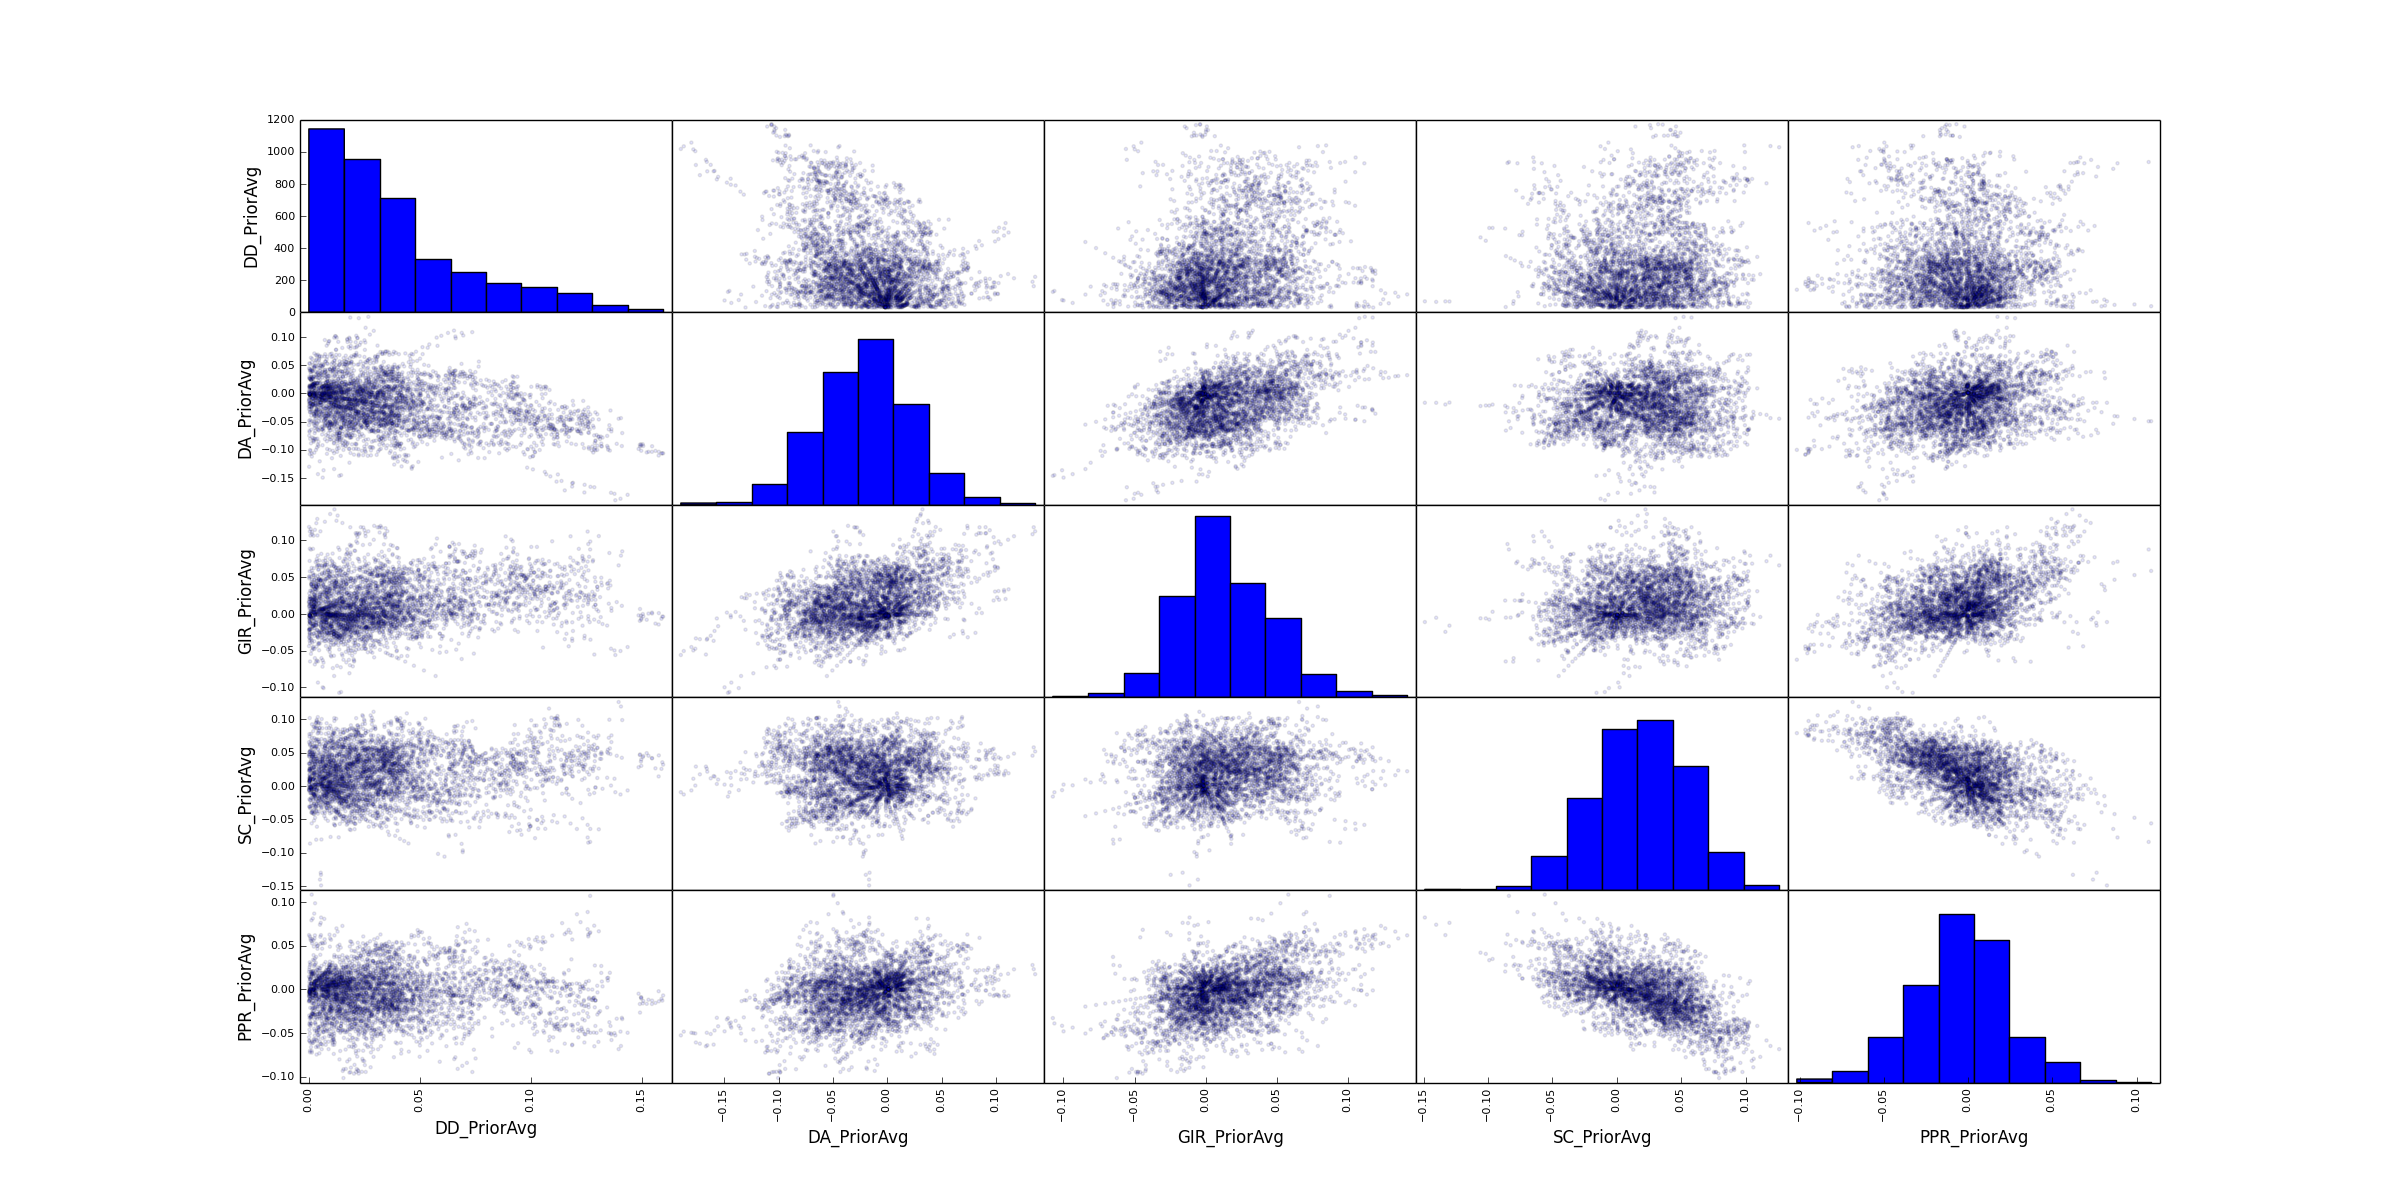
Squint hard enough, and correlations (i.e. diagonal lines) appear. Some are more connected than others, but you can get a general picture of how no stat is truly independent of any other.
There are some ways around the problems this poses. ShotLink data, when available, does a good job of isolating these skill sets (approach shots from varying yardages, strokes gained around the green, etc.), but I’ve cataloged my objections to ShotLink data to death at this point. Adjusting the raw numbers (like we do at FantasyLabs) removes a lot of the noise from the raw stats, but it doesn’t quite get to that next-level independence. But using some advanced analysis techniques, we can get around a lot of these effects and get to something resembling isolated skill metrics.
Next week, I’ll outline those techniques, along with the effects of adding that complexity.